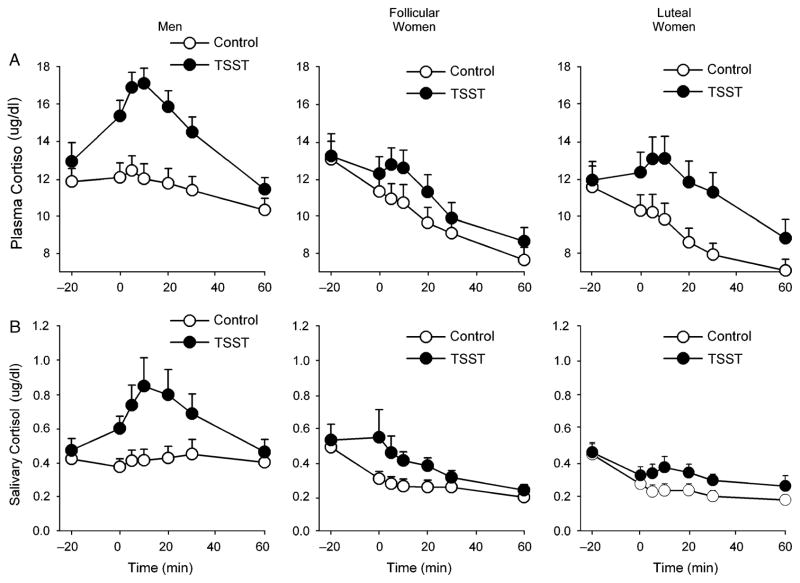
Figure 2.
Changes in plasma (A) and salivary (B) cortisol after the TSST (filled symbols) and control tasks (open symbols) for men (N=28), follicular women (N=29) and luteal women (N=23). Data represent mean ± SEM as a function of time after the task (Task preparation from −20 to −10 min, task performance from −10 to 0 min).

