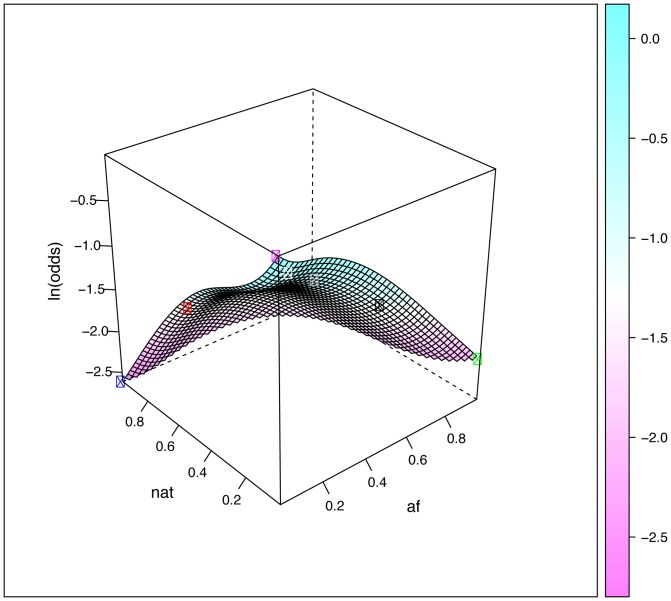
Figure 2. Surface plots describing the predicted relationship between the distribution of rs2470890 and parental ancestry, obtained by fitting piece-wise smooth logistic regression models to the 268 Brazilians and 224 Mexicans data.
The relative proportions of Native American and African ancestry are plotted in the x and y axes as appropriately labeled, whereas the relative proportion of European ancestry is inferred as the remaining proportion: 1- (af+nat). The plotted surface corresponds to the natural logarithm of the odds of having the variant rs2470890 T allele, depending on the relative admixture proportions of the parental populations. The odds refer to the ratio of the variant:wild-type alleles. For example the odds of having a variant allele frequency of 0.1 (wild-type frequency = 0.9) is 01/09 or 0.111. The corresponding Ln odds is −2.197. The circles correspond to the average ancestral proportions for Black Brazilians (black circle), Brown Braziilans (grey), White Brazilians (white), Mexicans (red), EUR (yellow), AFR (green) and NAT (blue).

