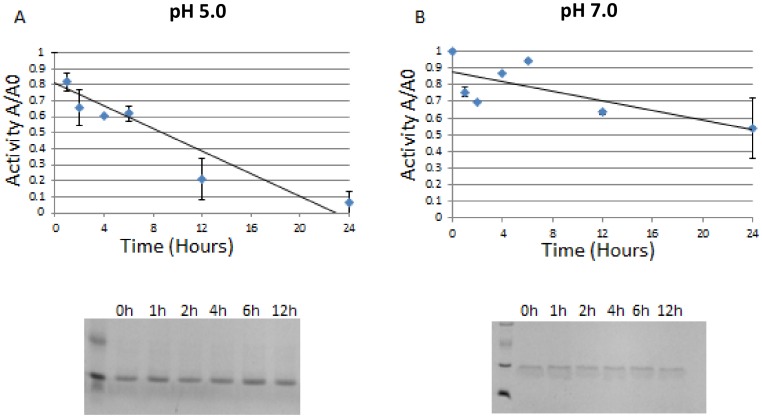
Figure 6. Studies on autodegradation of HIV-2 protease.
A: autodegradation analysis in a buffer composed of 50 mM sodium acetate and 50 mM sodium chloride (pH 5.0). B: autodegradation in buffer D (pH 7.0). X axis represents the incubation time in hours, Y axis represents A/A0 the ratio of active protein A at a given time to the total active protein A0 at time = 0. Autodegradation characterization was also performed on 16% SDS gel electrophoresis, the corresponding gel pictures are shown, the seemingly double banding seen in SDS-gel picture of B is due to artifact caused by the PR buffer composition.

