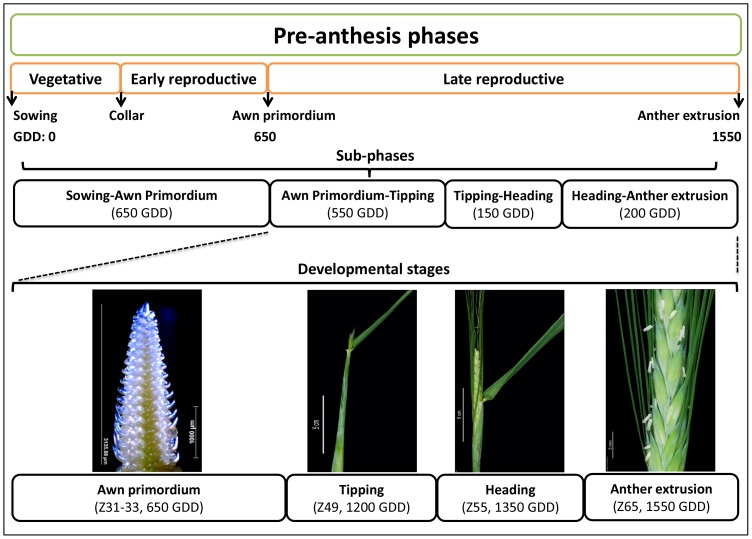
Figure 2. General figure of barley pre-anthesis phases.
The figure includes the beginning developmental point from sowing to each stage (e.g. time to tipping is 1200 GDD; i.e. from sowing time to tipping stage) and the differences between stages (phase; e.g. tipping to heading phase (150 GDD); i.e. GDD for heading stage (1350 GDD) minus tipping stage (1200 GDD)). GDD is the average GDD in the whole collection (i.e. including both photoperiod groups). This figure also describes the developmental stages and sub-phases which form the late reproductive phase as described in (Alqudah and Schnurbusch 2014).

