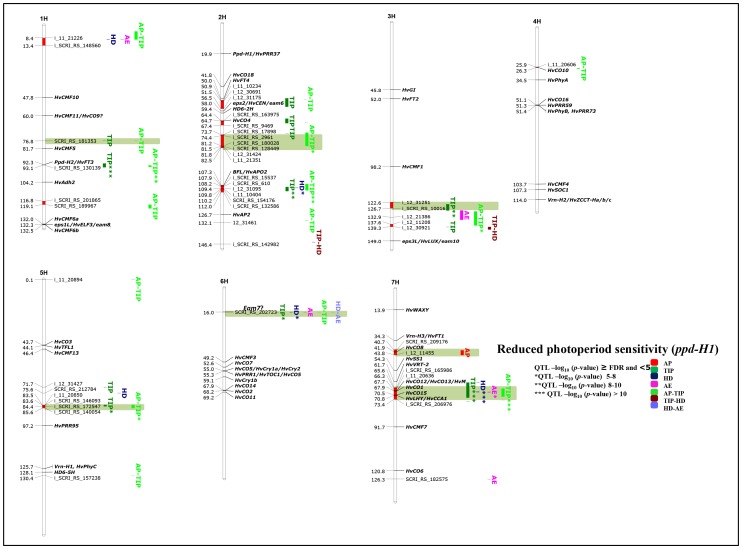
Figure 7. Genetically anchored position of highly associated QTLs at all barley developmental stages and sub-phases in the group carrying reduced photoperiod sensitivity (ppd-H1) using 9K SNP markers.
Bold and italicized gene names indicate genetically anchored positions of known heading time genes in the Barke x Morex RILs. Associated chromosomal regions are highlighted with different colors according to the stages and sub-phases. Red chromosomal areas indicate the range of significantly associated QTLs (within confidence interval ±5 cM) which are exceeding FDR level of each developmental stage or sub-phase. Highlighted chromosomal regions in light green denote group-specific associations.

