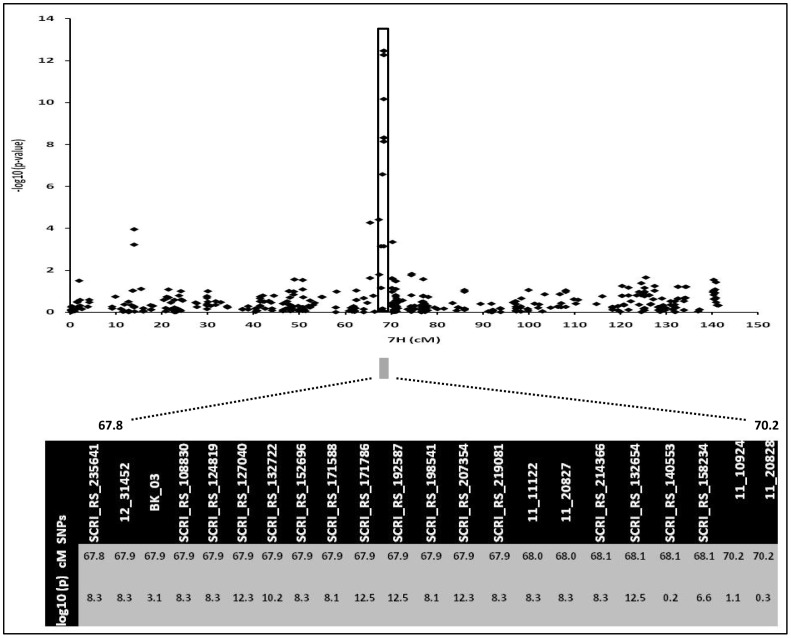
Figure 8. Regions of chromosome 7H showing association signals of the candidate gene (HvCO1) at the heading stage.
The top of the panel shows the region of the SNP marker peak (-log10 (p-value)). The lower panel zooms into a narrow region for the candidate region with the position and -log10 (p-value) of highly associated markers which are co-located with HvCO1 (67.9 cM).

