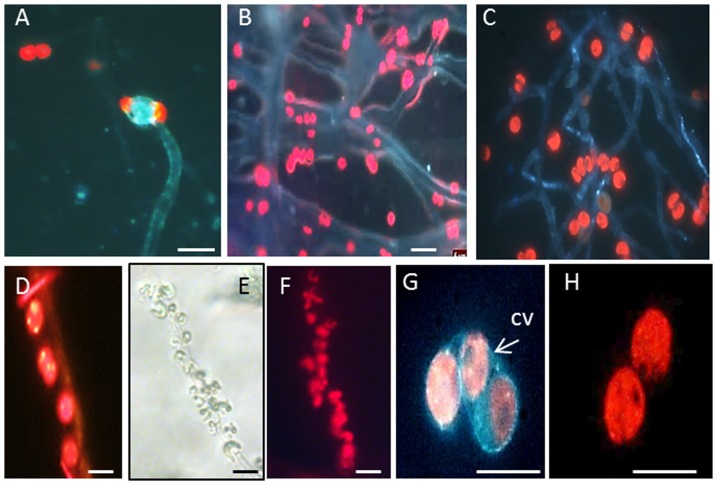
Figure 3. Microscopic analysis of A. fumigatus-miroalgal interactions.
Images of miroalgal cells attached to A. fumigatus filaments. A, B) D. tetrioletta; C,D) T. chuii; E,F): P. subcapitata; G,H) T. chuii. A,B,C,D,F,G,H: UV light images. Red spots represent chloroplast's fluorescence; E) bright-field image CV: cell walls. Scale = 20 µm.

