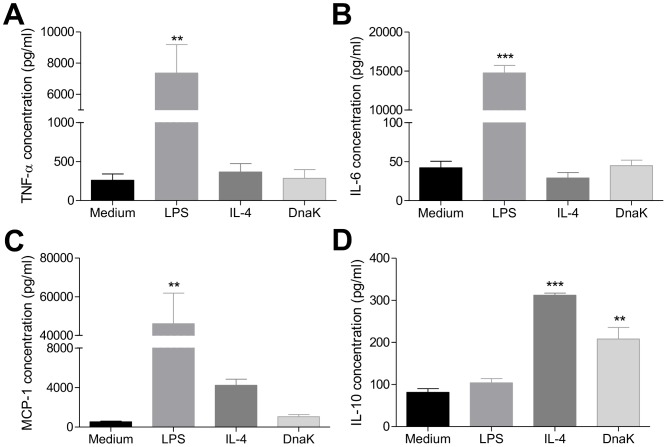
Figure 2. Macrophages release an M2-like cytokine profile upon stimulation with DnaK.
BMMs were treated with 30 ng/mL of LPS, 40 ng/mL of IL-4, 30 µg/mL or 60 µg/mL of DnaK or left unstimulated for 24 h. (A) TNF-α, (B) IL-6, (C) MCP-1 and (D) IL-10 were measured from culture supernatants by flow cytometry. The values represent means ± SEM in pg/ml from triplicates. (**) p<0.01 and (***) p<0.001 indicate significant difference between treated groups and medium group. All data has been by one-way ANOVA with Tukey post hoc test. Data representative of four independent experiments.

