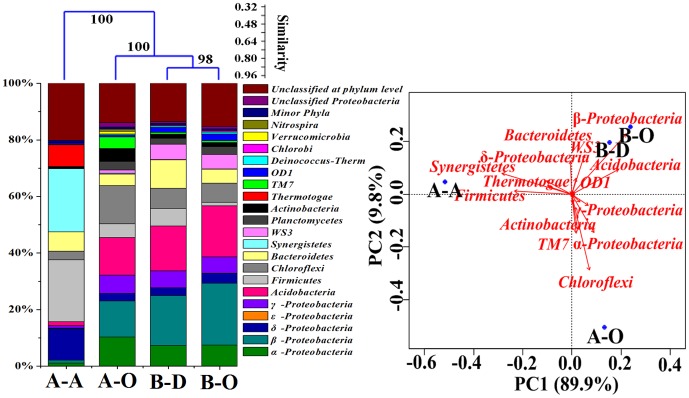
Figure 1. Abundance and distribution of different phyla and classes in Proteobacteria in the four sludge samples.
Taxa shown occurred in at least one sample with abundance over 1%. Minor phyla refer to the taxa with their maximum abundance <1% in each sample. The effective pyrosequencing reads (6,471 sequences) were classified using RDP Classifier at a confidence threshold of 50%. Cluster analysis was conducted based on a distance matrix computed with Bray–Curtis similarity of four samples. Principal component analysis was conducted based on the phylum abundance using R (version 3.0.1).

