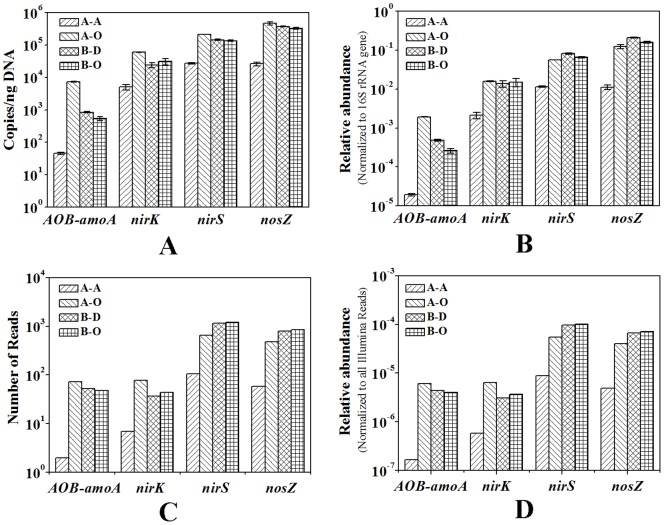
Figure 4. Abundance of amoA, nirK, nirS and nosZ genes in the four sludge samples revealed by qPCR (A and B) and metagenomic (alignment) approaches (C and D).
A: relative abundance of the genes normalized to the mass of the extracted DNA; B: relative abundance of the genes normalized to the abundance of 16S rRNA gene; C: Number of the Illumina sequencing reads aligned to the genes sequences in the local database at identity cutoff>90% and alignment length>50 bp; D: Relative abundance of the genes in the Illumina dataset of each sludge sample.

