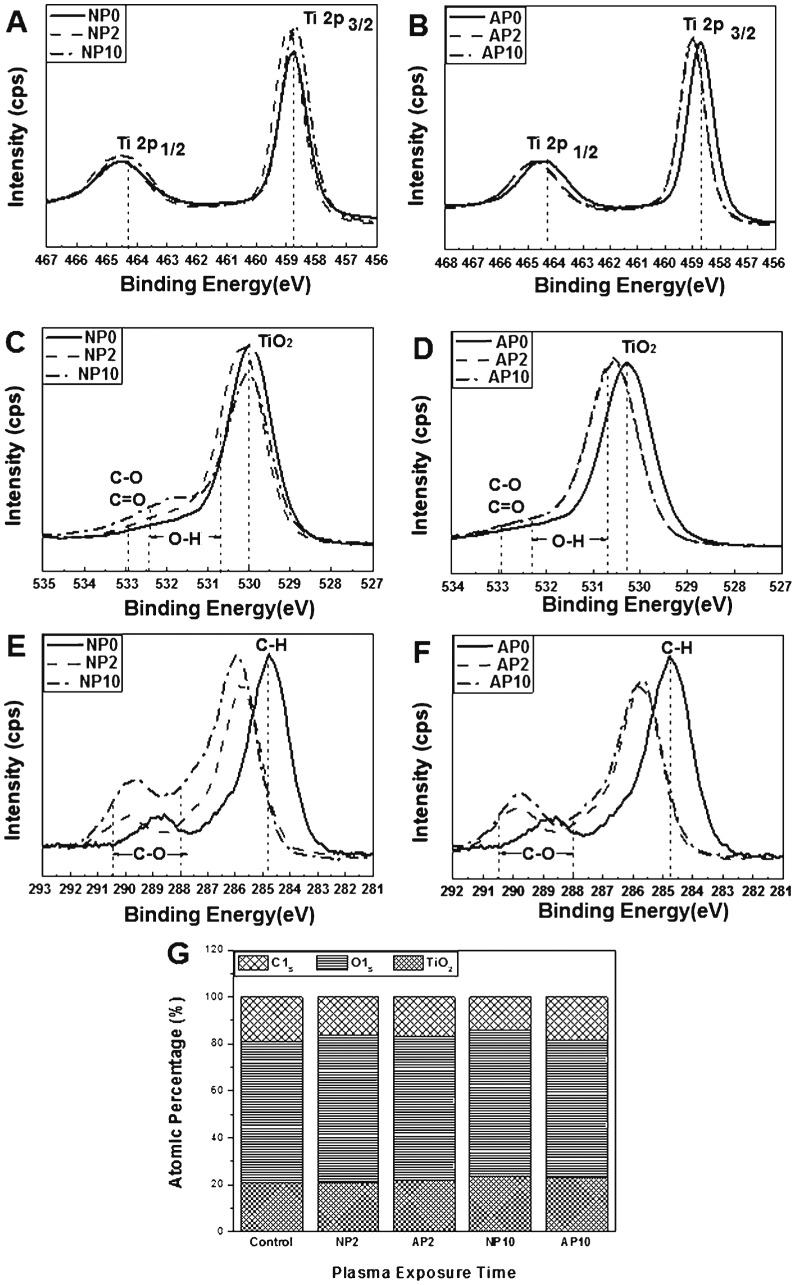
Figure 2. Chemical composition of a TiO2 nanotube surface measured with XPS.
(A, B) Ti2p spectra, (C, D) O1s spectra and (E, F) C1s spectra. (G) Atomic percentage of each element on the surface of TiO2 nanotubes before and after nitrogen- or air-based NTAPPJ treatment. NP0 and AP0: untreated TiO2 nanotubes with no treatment (control group); NP2: TiO2 nanotubes with 2-min nitrogen-based NTAPPJ; NP10: TiO2 nanotubes with 10-min nitrogen-based NTAPPJ; AP2: TiO2 nanotubes with 2-min air-based NTAPPJ; AP10: TiO2 nanotubes with 10-min air-based NTAPPJ.

