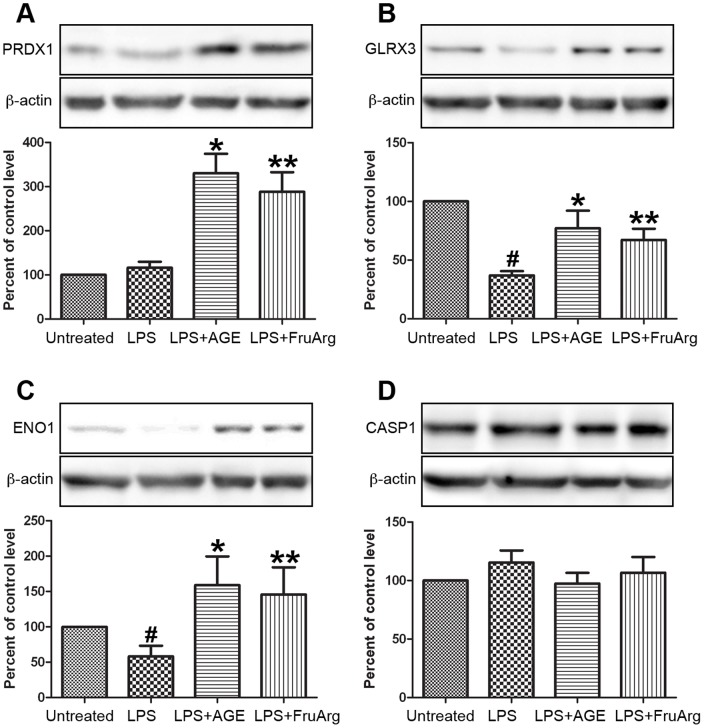
Figure 5. Validation of expression profiling of proteins by Western blotting.
Four of the identified proteins, PRDX1 (A), GLRX3 (B), ENO1 (C), and CASP1 (D), responding to AGE and/or FruArg treatment in LPS-stimulated BV-2 cells were validated using Western blotting. Protein intensities were quantified by Image J software, normalized to β-actin, and expressed as percentage of untreated controls. Data are means ± SEM (n≥5); #, P<0.05, untreated vs. LPS; *, P<0.05, LPS vs. LPS+AGE; **, P<0.05, LPS vs. LPS+FruArg.

