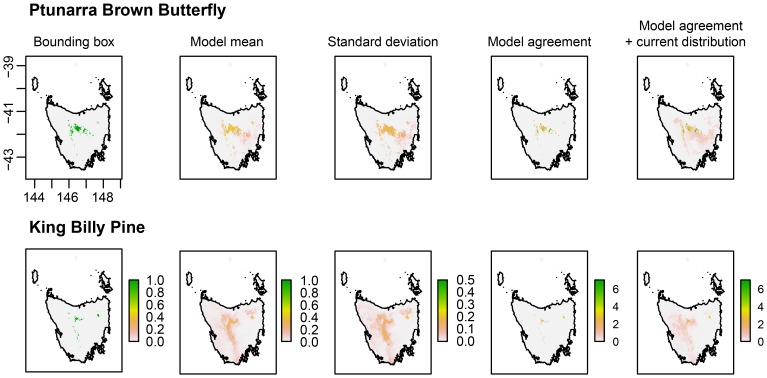
Figure 3. Alternative summaries for multiple species distribution models.
Maps are model summaries for the Ptunarra Brown Butterfly (left) and King Billy Pine (right) using models based on six GCM inputs; means and standard deviations (Row 1); spatial extents where at least one model indicates suitable habitat (Row 2); agreement between models, where at least one model predicted suitability above 0.5 (Row 3); model agreement overlayed on the baseline distribution for the species (Row 4).

