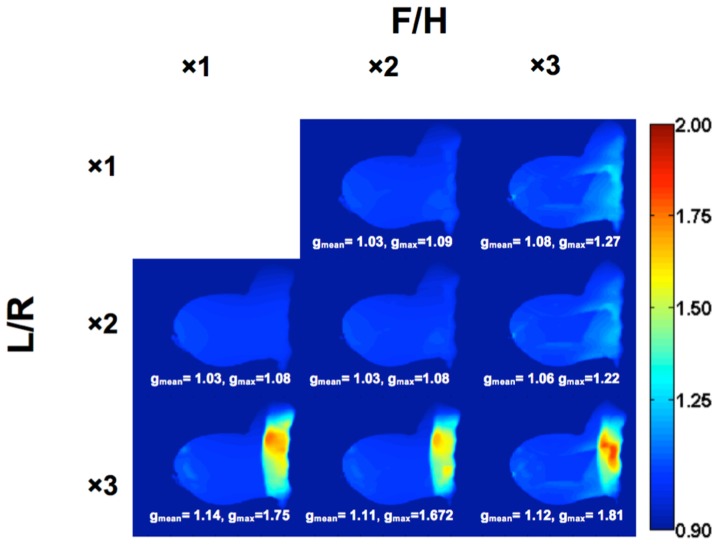
Figure 8. g-factor maps of a sagittal mid-slice in vivo.
SENSE acceleration was applied in the left-to-right (L/R) and foot-to-head (F/H) directions using acceleration factors of 1×, 2×, or 3× in each direction. With R = 4 (2×2), the mean and the maximum g-factor were 1.03 and 1.08, respectively, allowing for acquisition of just 25% of the k-space data. With the low g-factors, there should be negligible propagation of artifacts in the final reconstructed image.

