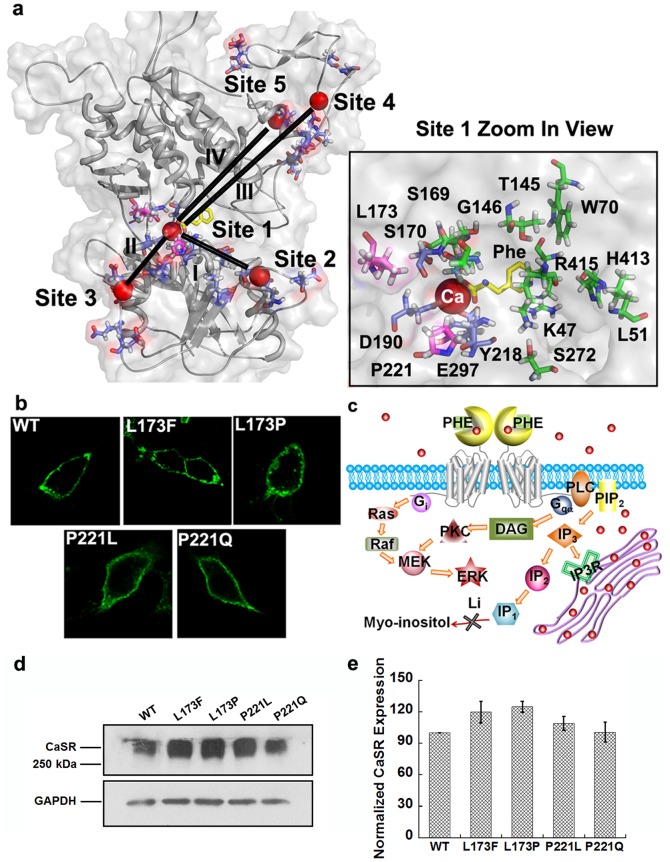
Figure 1. The disease-related mutations are located in the hinge region near Ca2+-binding site 1.
a. Model structure of CaSR ECD based on the mGluR1 crystal structure (PDB entry: 1ISR) was generated using MODELER 9v4 and Swiss-Model. The global view of the ECD is shown in the left panel. Spheres highlighted in red: Ca2+; Purple: residues involved in predicted Ca2+-binding sites. L-phenylalanine (in yellow) is positioned at the hinge region between the two lobes by Autodock vina. Right panel: A zoomed in view of the Ca2+-binding pocket of site 1. Residues involved in Ca2+-binding site 1are highlighted in purple; residues with disease-related mutations are highlighted in pink; residues predicted to interact with L-Phe are presented in green. b. Immunofluorescence analysis of surface expressed WT CaSR and its mutants in HEK293 cells. Immunostaining was done with anti-flag monoclonal antibody, and detection was carried out with Alex Fluor 488-conjugated, goat anti-mouse secondary antibody. Green: CaSR. The images were taken using equal exposure times. c. Schematic figure of calcium and L-Phe induced downstream signaling changes and the principle for the measurement of IP1 accumulation. Red dots represent calcium ions. d. total proteins (40 µg) were applied to SDS-PAGE under non-reducing conditions and blotted with anti-flag antibody. GAPDH was used as an internal control. e. The signals were analyzed using ImageJ and the normalized intensities were compared with WT CaSR.

