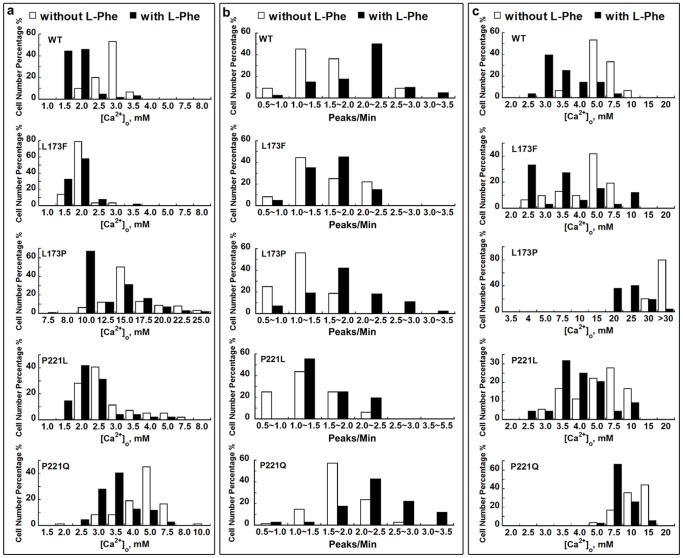
Figure 3. Frequency distribution of oscillation parameters in HEK293 cells transfected with CaSR or its mutants.
The pattern of the [Ca2+]i response in each cell (minimum of 40 cells) was analyzed. a. The [Ca2+]o at which individual cells started to oscillate was recorded. The X-axis comprises 1.0 mM to 8.0 mM [Ca2+]o for WT and for mutants L173F and P221L, 1.5 mM to 10.0 mM [Ca2+]o for P221Q or 7.5 mM to 25.0 mM for mutant L173P. b. The frequency of the individual cell oscillation patterns was investigated. For experiments without L-Phe, the peaks per minute were recorded at the levels of [Ca2+]o at which the majority of the cells (>50%) started oscillating. Specifically, for the gain-of-function mutants, the peaks per minute were recorded at 2.5 mM [Ca2+]o, while for loss-of-function mutants, the frequency was analyzed at 15.0 mM [Ca2+]o for L173P and 5.0 mM [Ca2+]o for P221Q. c. The [Ca2+]o at which the [Ca2+]i oscillations began to reach a plateau was recorded. Empty bar: in the absence of L-Phe; Black bar: in the presence of 5 mM L-Phe.

