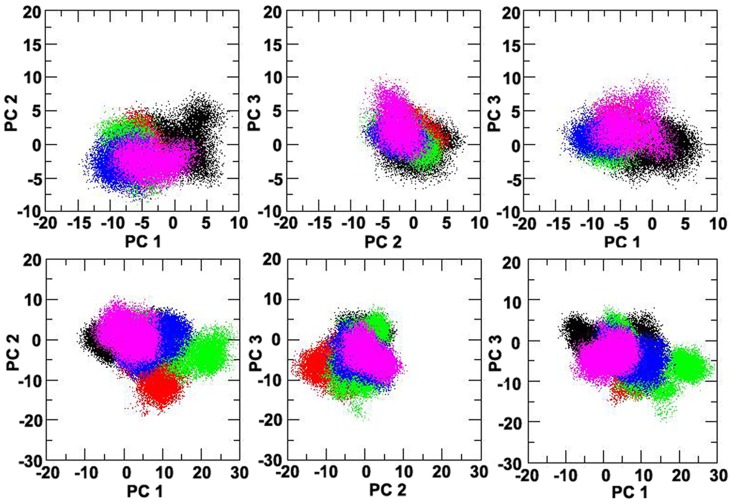
Figure 9. Principal component analysis (PCA) of the CaSR ECDs.
The trajectories of the molecular dynamics simulations were analyzed using principal component analysis (PCA), which separates out the motions of the CaSR ECD into principal modes ranked according to their relative contributions. The first three principal modes were included in the present study to analyze the four CaSR mutants and the wild type: WT (black), L173F (green), presence P221L (magenta), L173P (red), P221Q (blue).

