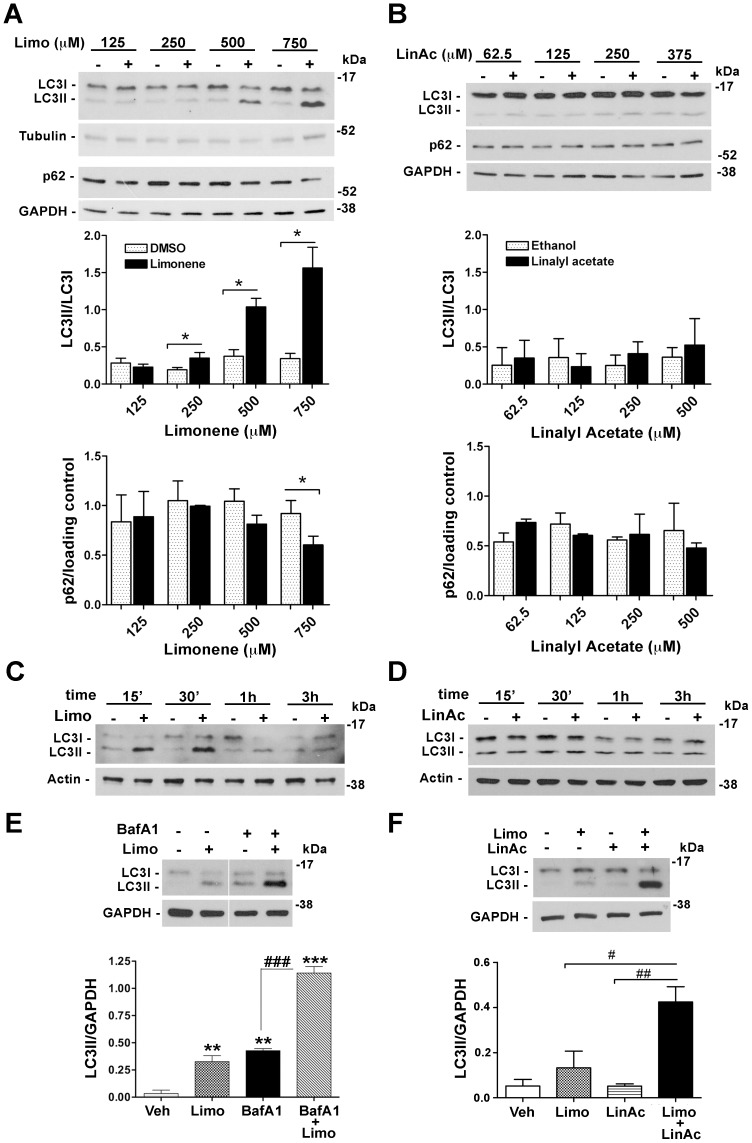
Figure 8. d-limonene is implicated in autophagy induced by BEO.
Concentration-dependent changes of LC3 lipidation and p62 expression following treatment with (A) d-limonene, (B) linalyl acetate and the corresponding vehicles for 30 min. Tubulin or GAPDH were used as loading control. Histograms show the results of densitometric analysis from three independent experiments (mean ± s.e.m.) *P<0.05 vs vehicle (Student's t test). (C, D) Representative immunoblots showing the time-dependent LC3I to LC3II conversion following exposure of SH-SY5Y cells to (C) d-limonene (500 µM) but not (D) linalyl acetate (250 µM). (E) Effects of BafA1 pretreatment on LC3 levels in SH-SY5Y exposed to d-limonene. Cells preincubated for 2 h with BafA1 (100 nM) were treated with d-limonene (750 µM) for 1 h. LC3II levels were detected by western blotting. Image from the autoradiographic film has been cut to remove irrelevant lanes. Histograms show the result of densitometric analysis from three independent experiments (mean ± s.e.m). **P<0.01, ***P<0.001 vs vehicle; ### P<0.001 (ANOVA followed by Tukey-Kramer multiple comparisons test). (F) Linalyl acetate enhances LC3 lipidation induced by d-limonene. Cells were incubated with vehicle or exposed to d-limonene (Limo, 500 µM) and linalyl acetate (LinAc, 250 µM), given individually or in combination. After 1 h incubation protein cell extracts were analyzed by western blot for LC3 levels. GAPDH was used as internal control. Histograms show the result of densitometric analysis from three independent experiments (mean ± s.e.m). # P<0.05, ## P<0.01 (ANOVA followed by Tukey-Kramer multiple comparisons test).

