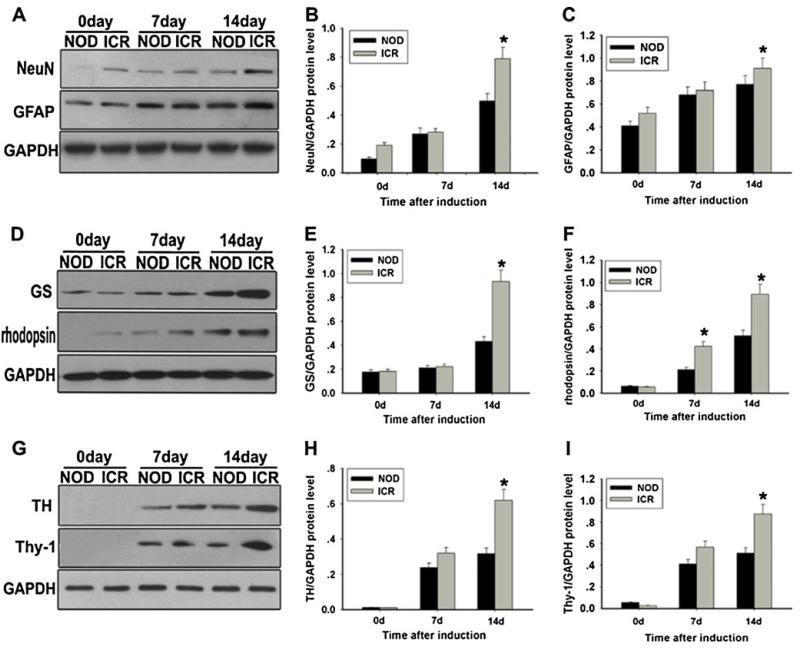
Fig. 1.
Analysis of retinal neuron-like differentiation potential between NOD-MSCs and ICR-MSCs by Western blot. a Western blot analysis of GFAP and NeuN expressions. b Quantification of GFAP protein levels. c Quantification of NeuN protein levels. d Western blot analysis of TH and Thy-1 expressions. e Quantification of TH protein levels. f Quantification of Thy-1 protein levels. g Western blot analysis of GS and rhodopsin expressions. h Quantification of GS protein levels. i Quantification of rhodopsin protein levels. GAPDH was used as the internal control. The levels of these proteins were significantly decreased in the NOD-MSCs compared with that in ICR-MSCs after BDNF, NGF, and bFGF induction for 7 and 14 days (*P<0.05; n=5)

