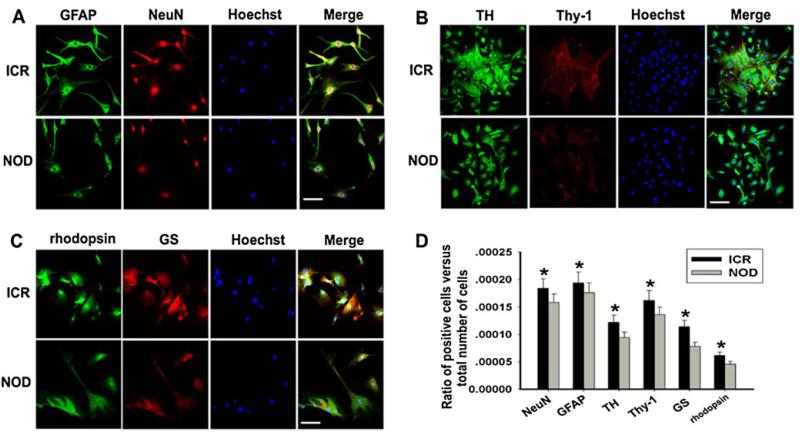
Fig. 2.
Analysis of retinal neuron-like differentiation potential between NOD-MSCs and ICR-MSCs by immunofluorescence. a Immunofluorescence staining of GFAP (green) and NeuN (red). Blue Hoechst stain. b Immunofluorescence staining of TH (green) and Thy-1 (red). Blue Hoechst stain. c Immunofluorescence staining of GS (green) and rhodopsin (red). Blue Hoechst stain. The immunofluorescence staining of retinal neuron-like markers in the NOD-MSCs had a low intensity compared with the ICR-MSCs after induction for 14 days. Scale bar= 25 μm. d Quantitative evaluation of differentiated ratio: NOD-MSCs versus ICR-MSCs. The ratio of positive cells versus total number of cells in the culture: comparison of NOD-MSCs and ICR-MSCs. In this study, GFAP-, NeuN-, TH-, Thy-1-, GS-, and rhodopsin-positive cells were counted 14 days after induction (*P<0.05; n=5)

