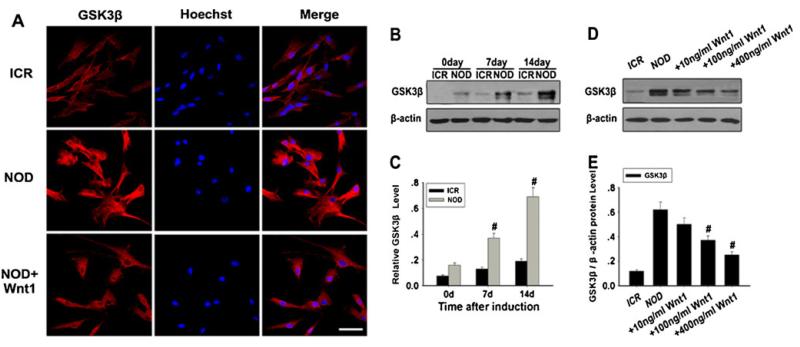
Fig. 5.
Analysis of GSK-3β expression in NOD-MSCs. a Immunofluorescence staining of GSK-3 Compared with that in the NOD-MSCs, GSK-3β expression was weak in the ICR-MSCs. However, after treatment with 400 ng/ml Wnt1, the GSK-3β expression decreased in NOD-MSCs. Red GSK-3β, blue Hoechst. Scale bar=25 μm. b Western blot analysis of GSK-3β expression. β-Actin was used as the internal control. c Quantification of GSK-3β protein levels. After BDNF, NGF, and bFGF treatment for 7 and 14 days, GSK-3β protein levels were significantly decreased in the NOD-MSCs compared with that of the ICR-MSCs (#P<0.05; n=5). d Western blot analysis of the GSK-3β expressions after treatment with Wnt1 (10–400 ng/ml). e Quantification of the GSK-3β protein levels after treatment with Wnt1 (10–400 ng/ml). Wnt1 concentrations >100 ng/mL were sufficient to decrease GSK-3β expression (#P<0.05; n=5)

