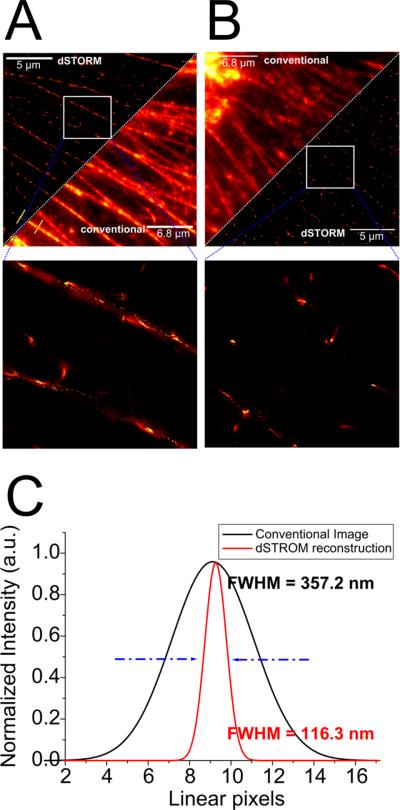
Figure 3.
A and B show a side-by-side comparison of a conventional fluorescence image and a dSTORM reconstruction of immunostained F-actin filaments in HAEC cells. A. Depicts the control case, whereas B monitors a treated cell. C represents a direct quantification of the determined resolution (localization precision)

