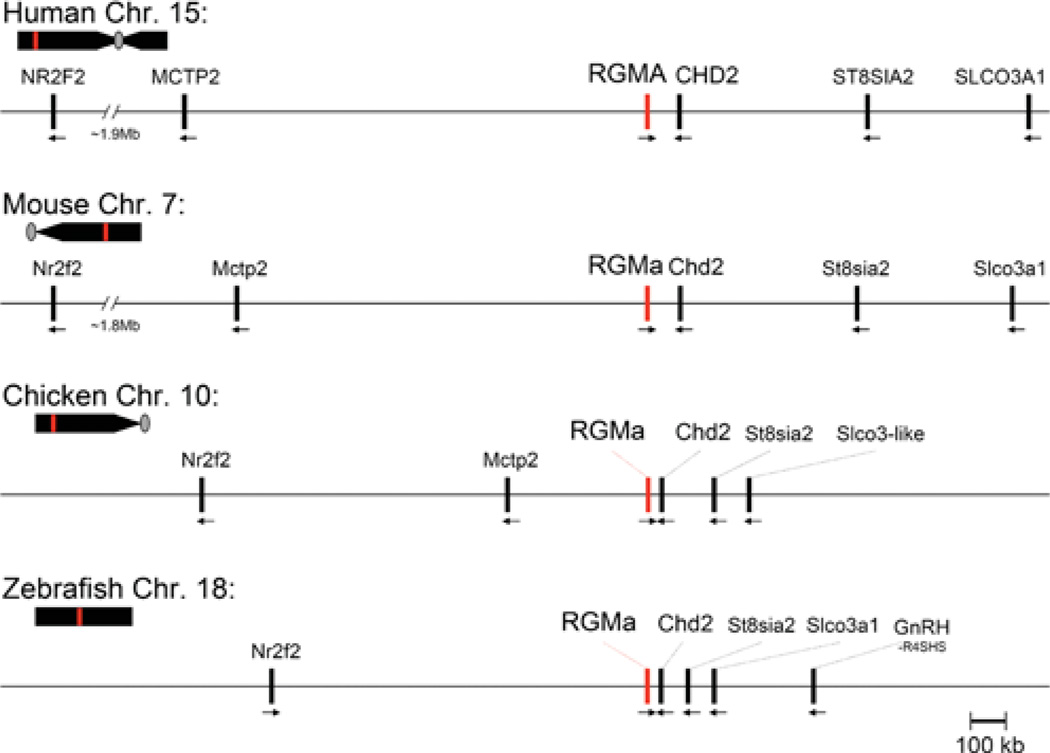
Figure 1. Comparative structures of RGMa genomic loci.
The relative position of the RGMa gene (red line) is indicated on each chromosome (Chr.; human 15, mouse 7, chicken 10, zebrafish 18) in relation to the centromere (grey oval, if information available) and telomere. Presented below each chromosome is a higher resolution view of the RGMa locus for each species. Neighbouring genes are indicated, with the transcriptional direction represented by an arrow. Gene names corresponding to the abbreviations may be found in Table 4.

