Fig. 1.
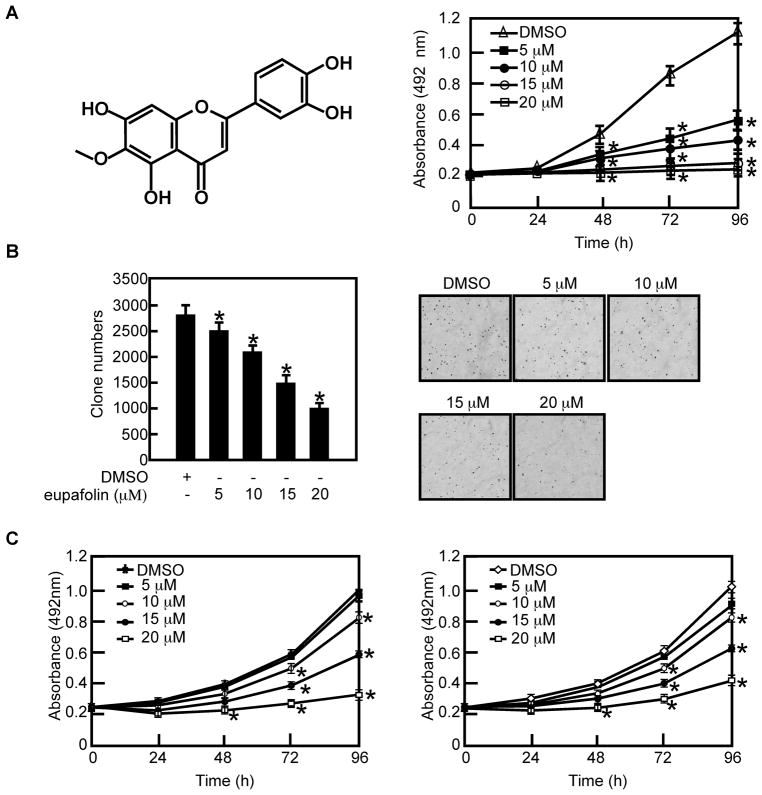
Eupafolin inhibits proliferation and anchorage-independent growth of prostate cancer cells. A, left panel, the chemical structure of eupafolin. Right panel, eupafolin suppresses PC3 cell proliferation in a dose-dependent manner. PC3 cells (3 × 10³ cells/well) were treated with the indicated doses of eupafolin for the specified times. The absorbance was measured as described in “Materials and Methods”. Data are shown as means ± S.D. and the asterisk (*) indicates a significant (p < 0.05) decrease in proliferation of cells treated with eupafolin compared to untreated control cells. B, eupafolin suppresses anchorage-independent growth of PC3 cells. Bar graphs depict the inhibitory effect of eupafolin on PC3 cells (left panel). Colony numbers are shown as means ± S.D. from 3 independent experiments. The asterisk (*) indicates a significant (p < 0.05) decrease in colony numbers in cells treated with eupafolin compared to the DMSO-treated group. Representative photographs of colony formation are shown in the right panels. C, eupafolin suppresses DU 145 (left panel) and LNCaP (right panel) prostate cancer cell proliferation. Cells (3 × 10³ cells/well) were treated with the indicated doses of eupafolin for the specified times. The absorbance was measured as described in “Materials and Methods”. Data are shown as means ± S.D. and the asterisk (*) indicates a significant (p < 0.05) decrease in proliferation in cells treated with eupafolin compared to untreated control cells.

