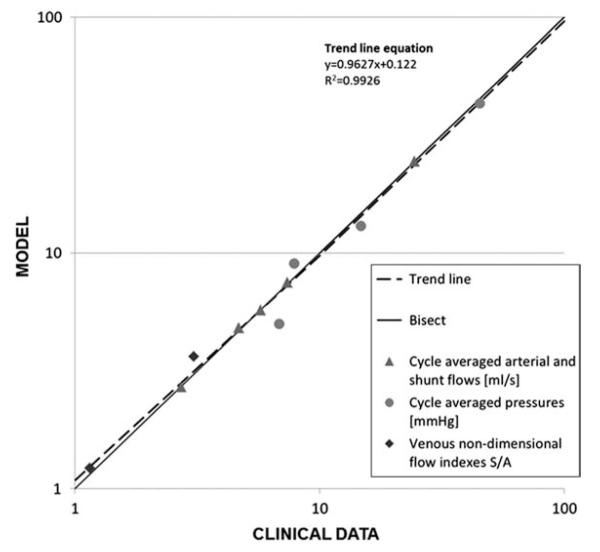
Figure 7.
LPM results vs. clinical data: time-averaged (over cardiac cycle) arterial and shunt flows, pressures, SVC and IVC non-dimensional venous flow indexes S/A (calculated as the ratio between the S-wave and the A-wave during atrial contraction). The trend line (dashed) is obtained by best fitting the LPM results. The x- and y-axes are shown in a logarithmic scale.

