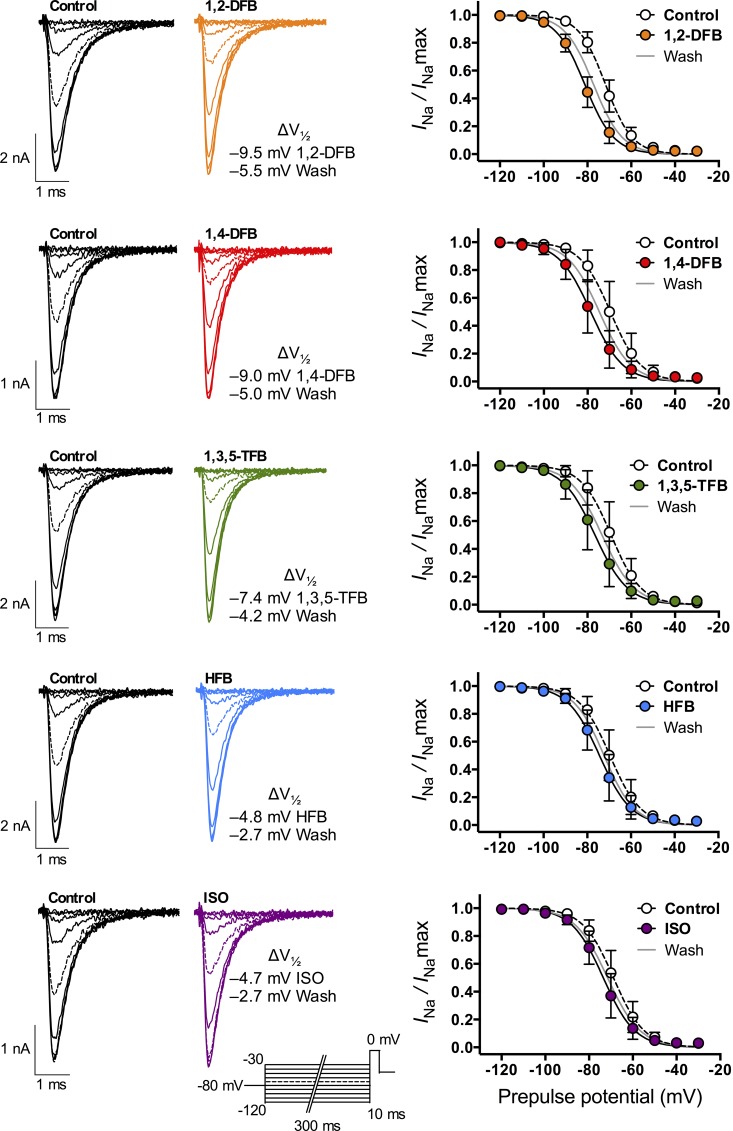
Figure 3.
Na+ channel steady-state inactivation. Na+ channel availability (or h∞) was tested using a double-pulse protocol with a 300-ms prepulse ranging from −120 to −30 mV in 10-mV steps, followed by a 10-ms test pulse to 0 mV (inset at ISO traces shows stimulation protocol). Peak INa was normalized (INa/INamax), plotted against prepulse potential, and fitted with a two-state Boltzmann distribution to calculate V1/2 (see Materials and methods for details). (Left) Families of Na+ current traces in the absence (black traces, control) or presence (colored traces, drug) of anesthetics at 1 MAC. (Right) Fitted data in the absence (open circles, dotted line) or presence (full colored circles, straight black line) of anesthetic, or after washout (straight gray line). All anesthetics caused a significant left-shift of V1/2 with values displayed next to each graph (see Table 3). Data are mean ± SD; n = 5–7.

