Figure 4.
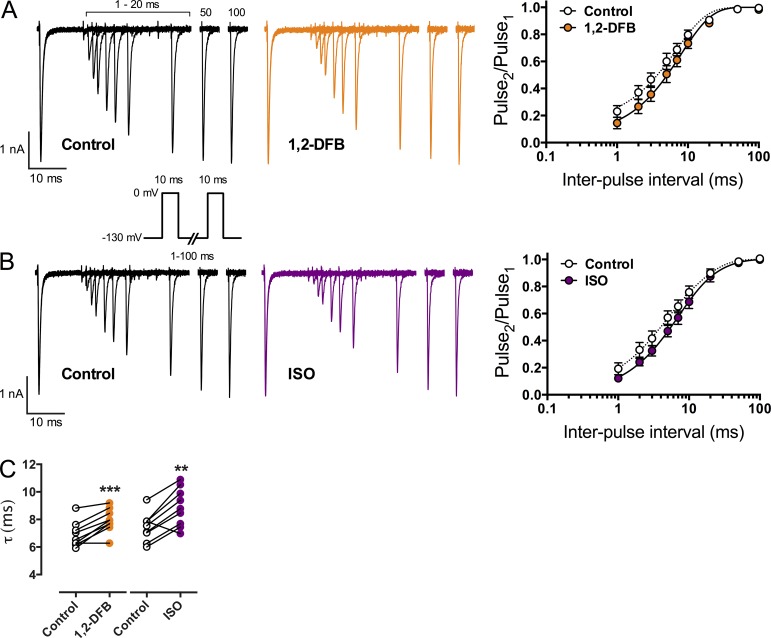
Na+ channel recovery from inactivation. A two-pulse protocol was used from a holding potential (Vh) of −130 mV, with two 10-ms test pulses to 0 mV separated by an interpulse interval from 1 to 100 ms (inset shows stimulation protocol). Peak INa of the second test pulse was normalized to the first (Pulse2/Pulse1) and plotted against the interpulse interval. Data were fitted to a mono-exponential equation to calculate the time constant τ (see Materials and methods for details). (A and B; left) Overlaid macroscopic Na+ current traces of the two pulses with increasing interpulse durations in the absence (black traces, control) or presence (colored traces, drug) of anesthetic at 1 MAC. Peak INa of the second test pulse slowly recovers to control values with increasing interpulse durations. (A and B; right) Fitted data in the absence (open circles, dotted line) or presence (closed colored circles, straight line) of anesthetic. (C) Recovery time constant τ in the absence (open circles) or presence (colored circles) of anesthetic. Both anesthetics significantly increased τ, thereby slowing recovery from inactivation. Data are mean ± SD; n = 9. **, P < 0.01 and ***, P < 0.001 versus control by paired two-tailed Student’s t test.

