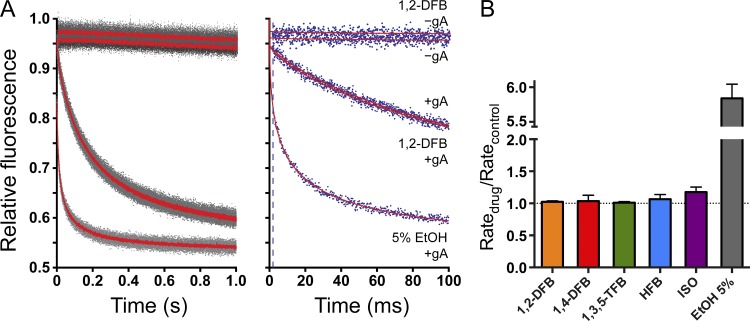
Figure 5.
Effects of anesthetics on lipid bilayer properties using a GBFA. (A) Examples of normalized fluorescence quench traces. (Left) Time course of normalized fluorescence decay over 1 s. Gray dots denote results from all repeats (more than five per condition), and red solid lines indicate the average of all repeats. (Right) The first 100 ms of the normalized fluorescence decay. Blue dots denote results from a single repeat for each condition; red lines correspond to the stretched exponential fits (2–100 ms) to those repeats; and the broken line marks the 2-ms time point, at which quenching rate is determined. In both panels, the top two traces show the results without gramicidin (gA) in the presence (1,2-DFB − gA) or absence (−gA) of 1,2-DFB. The next two overlapping red traces show control gA in the absence (+gA) or presence (1,2-DFB + gA) of 1,2-DFB. The bottom trace corresponds to gA-containing vesicles treated with 5% ethanol (5% EtOH + gA) as a positive control. (B) The rate of quencher influx for anesthetics at 1 MAC and ethanol. None of the anesthetics significantly altered lipid bilayer properties at clinically relevant concentrations. Data are mean ± SD; n = 3–4.

