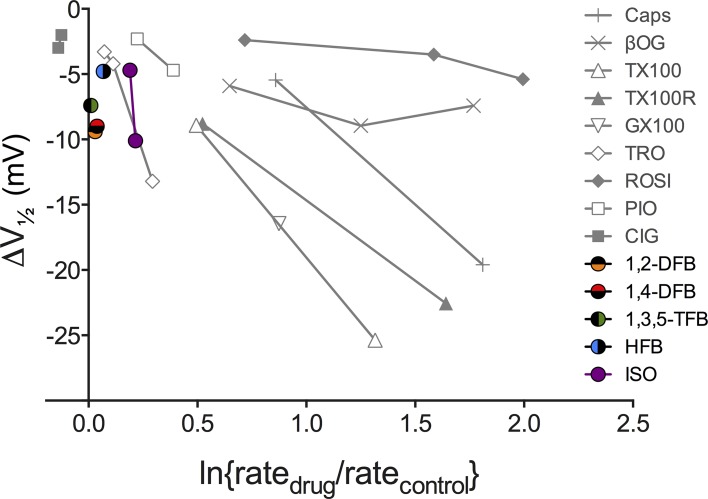
Figure 8.
Relation between bilayer-modifying effects and alteration of Nav function for various drugs and other amphiphiles. Plot of amphiphile-induced changes in the midpoints of the Nav inactivation curve (V1/2) against changes in the fluorescence quench rate measured using the GBFA. The gray points denote results for bilayer-modifying amphiphiles that have been examined in previous studies (Lundbæk et al., 2005; Rusinova et al., 2011). The colored points show results for the anesthetics from this study. The amphiphile-induced shifts in V1/2 are from Rusinova et al. (2011); the second ISO concentration is from Ouyang et al. (2009); except for the results for Genapol X-100 and reduced Triton X-100, which were done as part of this study, the amphiphile-induced changes in quench rates are from Ingólfsson and Andersen (2010) and Rusinova et al. (2011). Caps, capsaicin; βOG, β-octyl-glucoside; TX100, Triton X-100; TX100R, reduced Triton X-100; GX100, Genapol X-100; TRO, troglitazone; ROSI, rosiglitazone; PIO, pioglitazone; CIG, ciglitazone.

