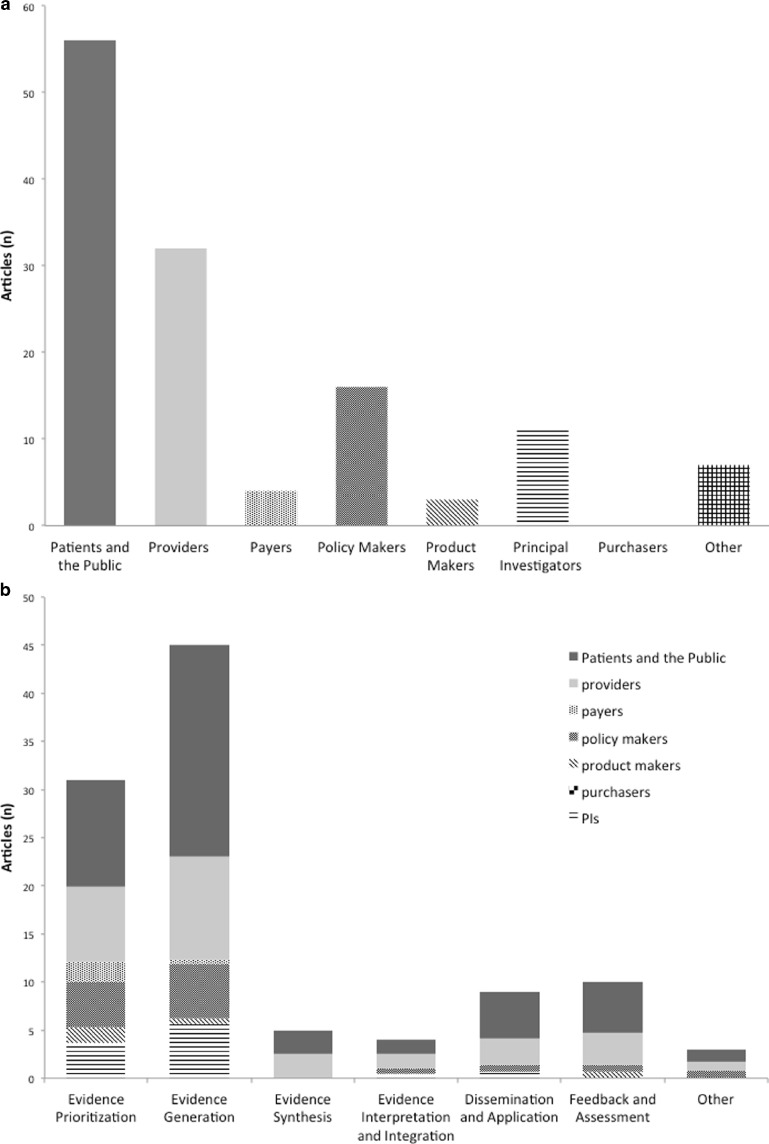
Figure 2.
Who are the stakeholders and in what stages of research are they engaged? Panel A presents the frequencies of articles mentioning engagement with each of the seven stakeholder categories in the 7Ps Framework. Because articles might report engagement with multiple stakeholder groups, the denominator for each bar in this histogram equals 70. In Panel B, the share of each bar presenting engagement with a stakeholder group represents the probability of engagement with that group within the stage of research. Because an article could span multiple stages of research, the total reports of engagement in the six research stages equals more than 70 (n = 107).

