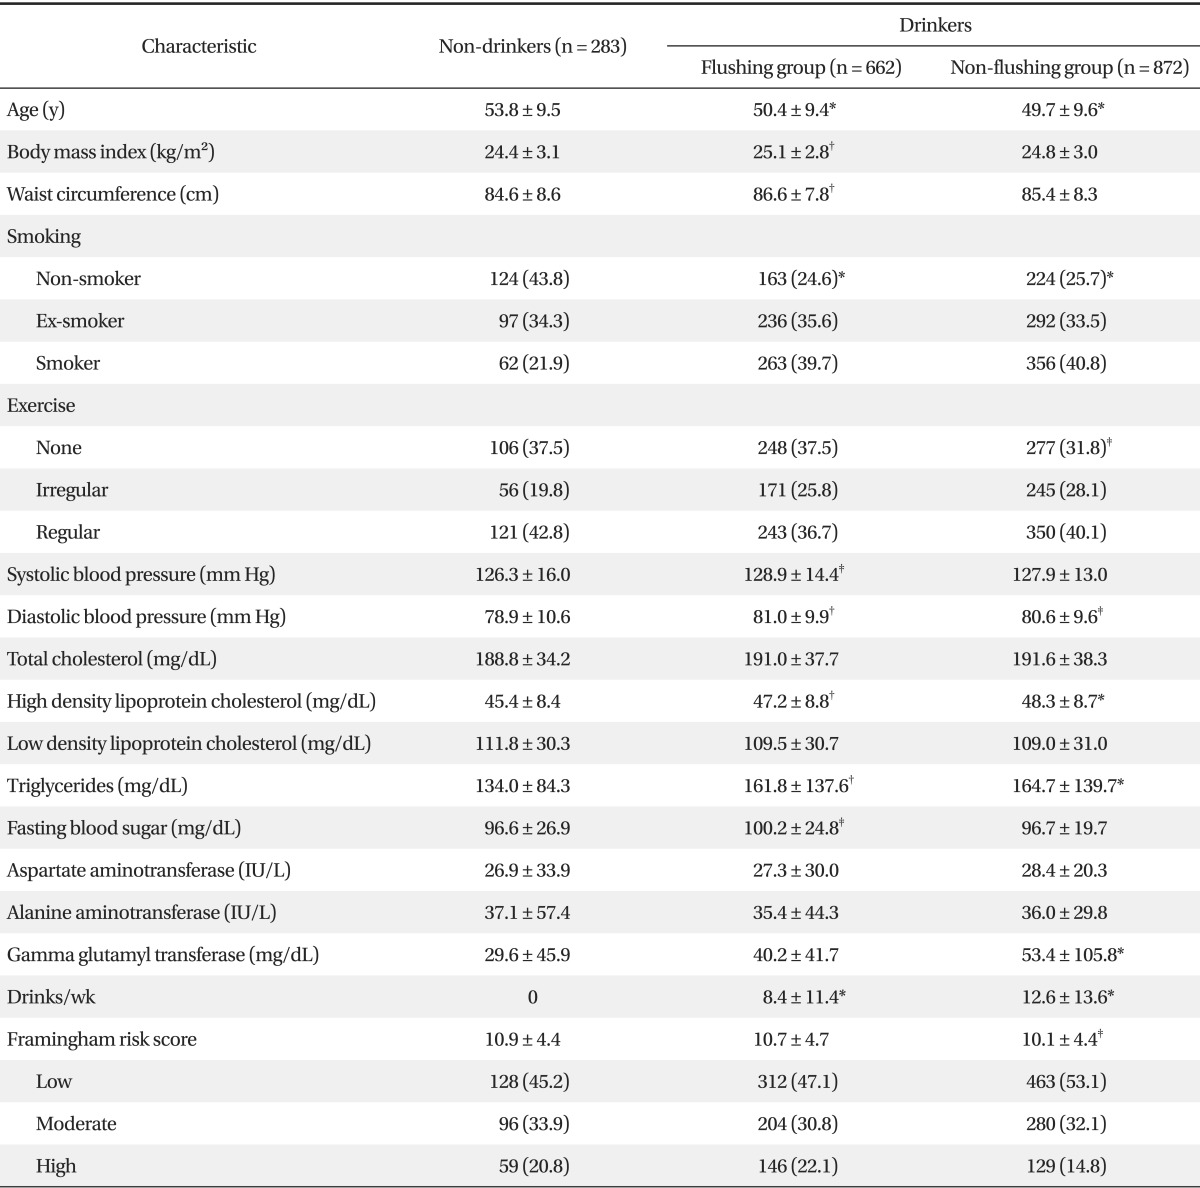
Table 1.
Characteristics of the subjects

Values are presented as mean ± SD or number (%).
*<0.001. †<0.01. ‡<0.05 by the t-test with Bonferroni correction or chi-square test compared with non-drinkers.
Characteristics of the subjects

Values are presented as mean ± SD or number (%).
*<0.001. †<0.01. ‡<0.05 by the t-test with Bonferroni correction or chi-square test compared with non-drinkers.