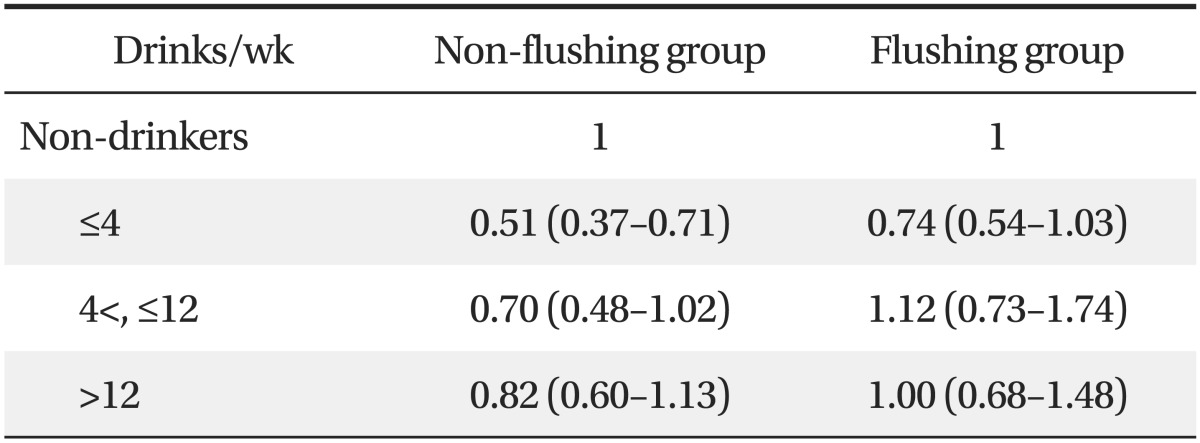
Table 2.
Logistic regression analysis* on higher than low 10-year cardiovascular disease risk† according to weekly drinking quantity in the non-flushing and flushing groups

Values are presented as odds ratio* (95% confidence interval).
*Adjusted for diastolic blood pressure, exercise, body mass index, low density lipoprotein cholesterol, and triglycerides. †Defined as 10-year cardiovascular disease risk ≥ 10%.
