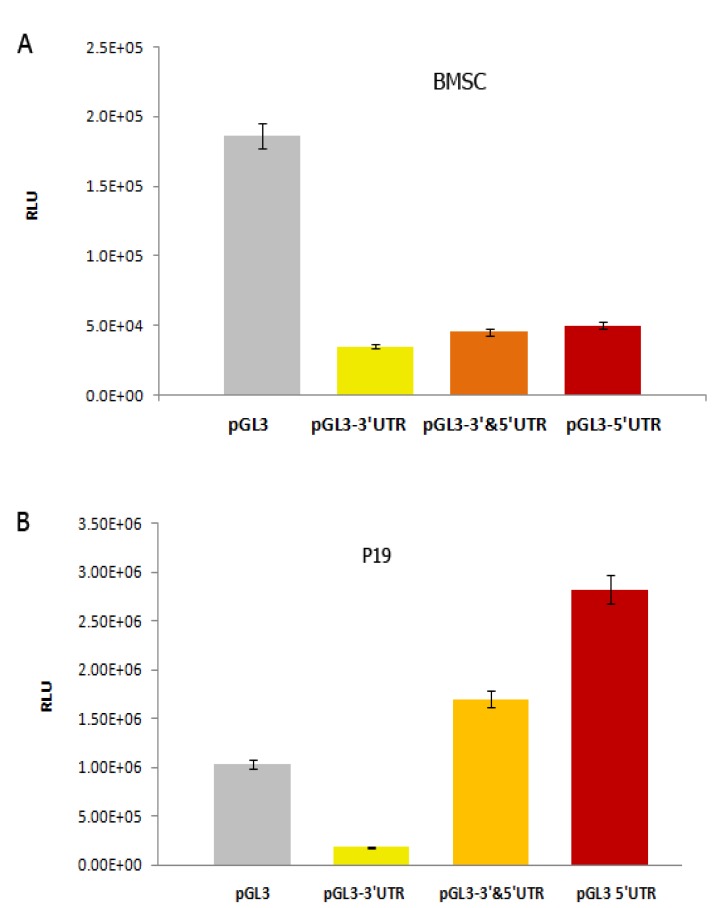
Figure 3.
Graphs indicating the effects of transfected vectors on luciferase expression. A) In upper graph, transfection of BMSCs with pGL3-3´UTR, pGL3- 5´& 3´ UTRs and pGL3- 5´UTR vectors resulted in a significant decrease of luciferace expression (P<0.05). B) In lower graph, trasfection of P19 with pGL3 3´UTR vector led to a significant reduction (P<0.05), while transfection with pGL3-5´&3´UTRs and pGL3-5´UTR induced an increase of luciferase expression. The vertical axis shows luciferase expression in terms of RLU (relative light unit)

