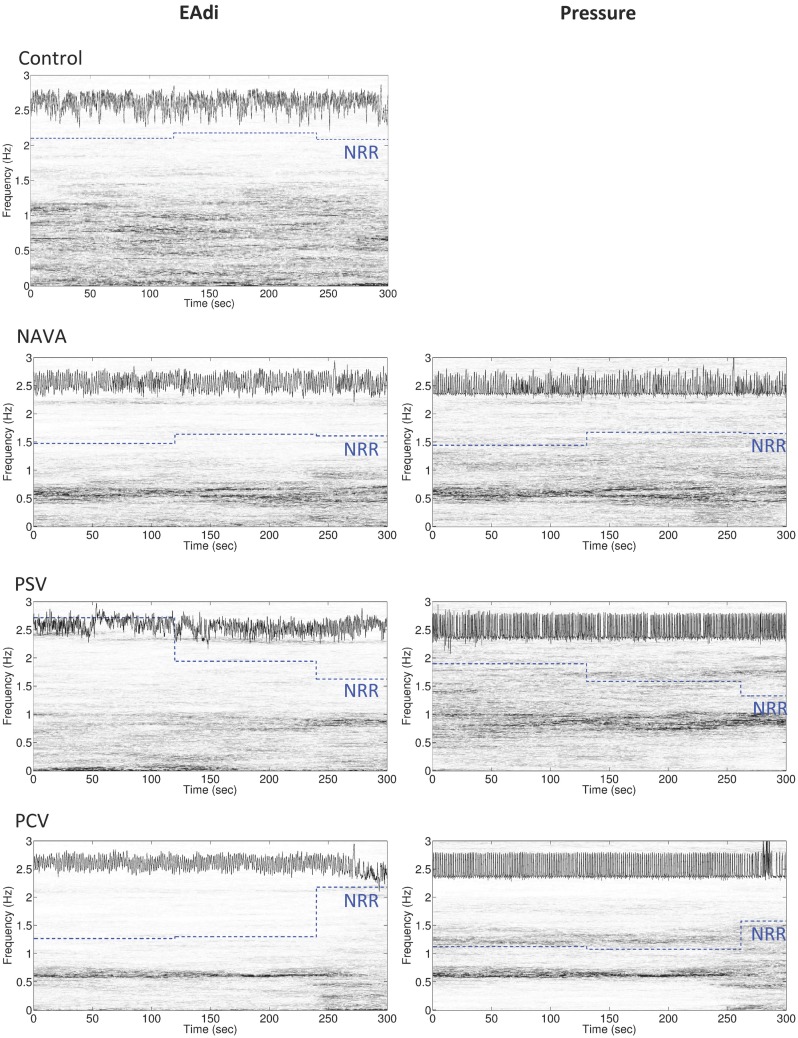
Figure 2.
Representative example of the variability of non-rhythmic to rhythmic (NRR) index for electrical activity of the diaphragm (EAdi, left panels) and pressure (right panels) over 5 min in an infant during mechanical ventilation in neurally adjusted ventilatory assist (NAVA), pressure support ventilation (PSV), and pressure-controlled ventilation (PCV), and in a spontaneously breathing infant (control, with only EAdi signal). In each panel, the original signal is displayed in the upper part of the box (the signal on the EAdi column is the log 10 of the original EAdi signal), the time-varying power spectrum (the time–frequency representation determined by synchrosqueezing transform) is continuously represented on a vertical axis (gray distribution), and the piecewise constant blue dotted lines represent the NRR shifted up by 1.3 for the corresponding 2 min intervals. Note that the more rhythmic the oscillation is, the smaller the NRR value becomes. Also note the change in power spectra of both pressure and EAdi at the end of the PCV recording, which is translated into an increase in NRR.

