Figure 1.

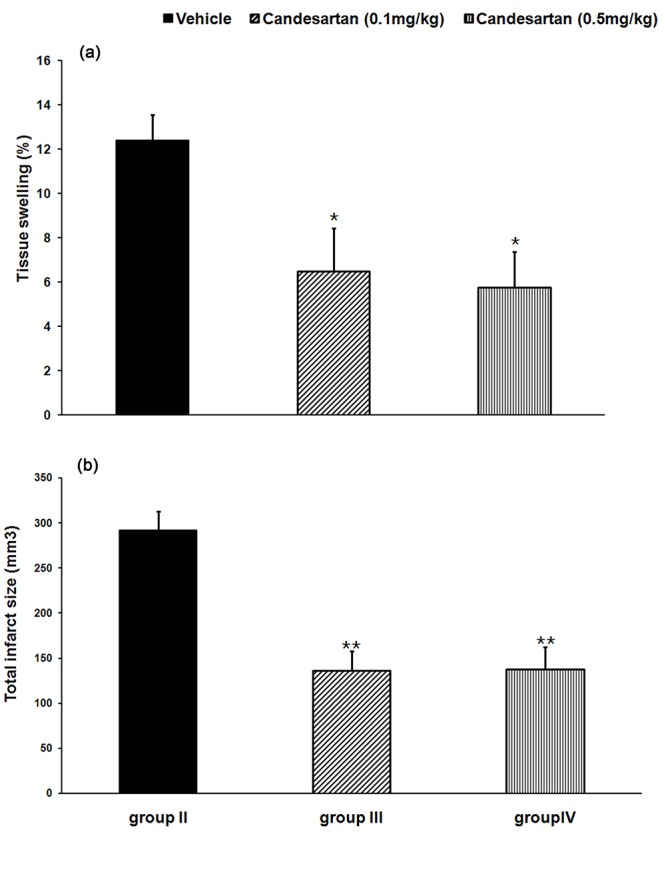
Tissue swelling (a) and total infarct size (b) in the studied groups. Values are mean±SEM of eight rats in each group. *P<0.05, **P<0.001 significant as compared with the respective vehicle-treated control rats (group II).

Tissue swelling (a) and total infarct size (b) in the studied groups. Values are mean±SEM of eight rats in each group. *P<0.05, **P<0.001 significant as compared with the respective vehicle-treated control rats (group II).