
Figure 2.
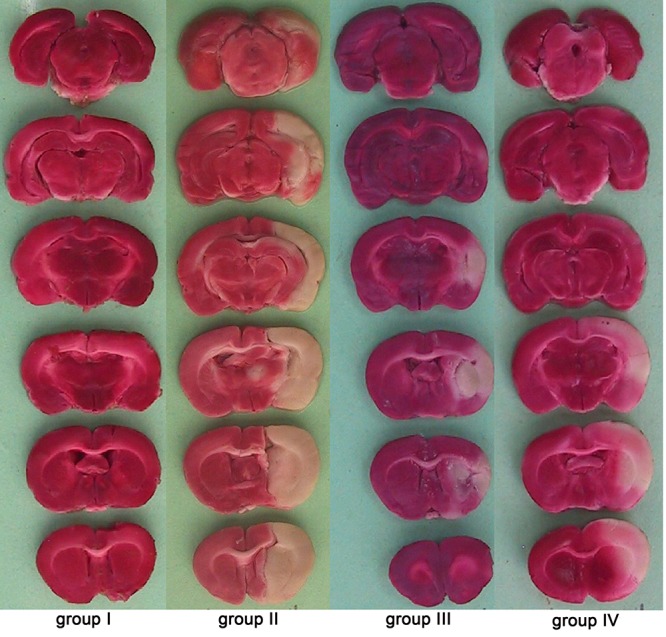
Representative brain slices stained with TTC in the studied groups. Ischemic regions are white and non-ischemic regions are red colored.
Official websites use .gov
A
.gov website belongs to an official
government organization in the United States.
Secure .gov websites use HTTPS
A lock (
) or https:// means you've safely
connected to the .gov website. Share sensitive
information only on official, secure websites.
Representative brain slices stained with TTC in the studied groups. Ischemic regions are white and non-ischemic regions are red colored.