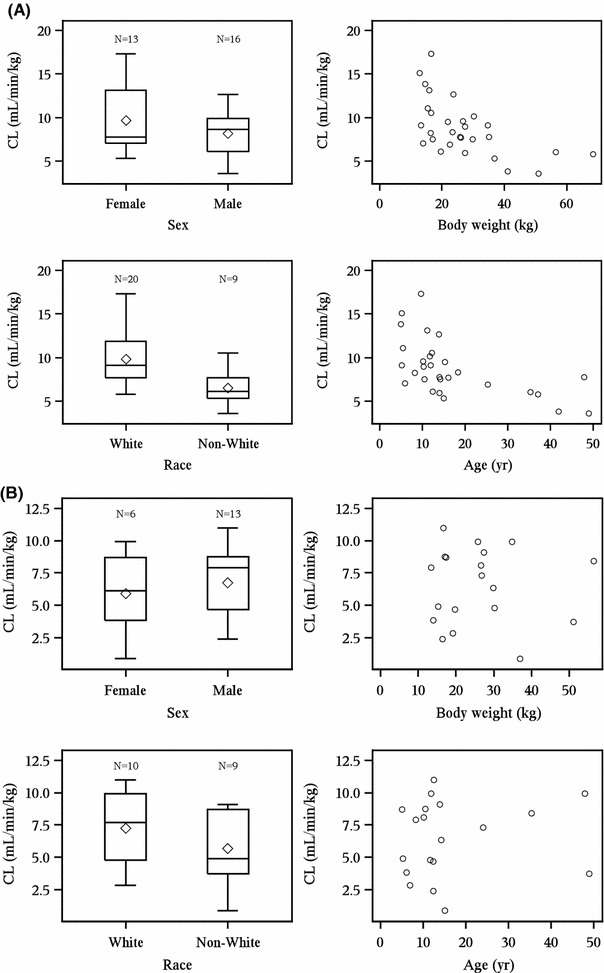
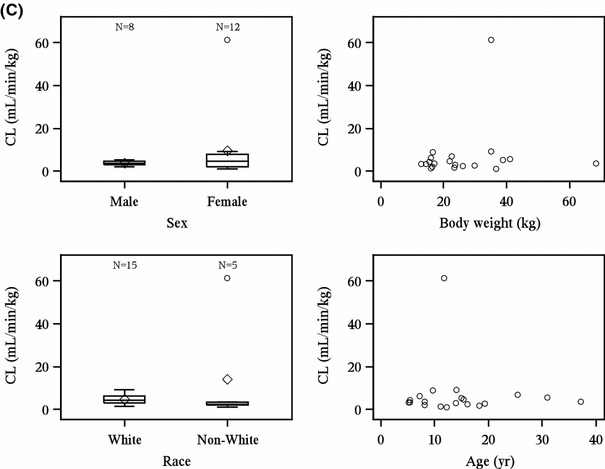
Fig. 2.


Patient demographics and pharmacokinetic results. Patient demographics and pharmacokinetic results at (a) week 0; (b) week 22, QOW dosing group; (c) week 22, QW dosing group. CL total clearance of drug after intravenous administration, QOW every other week, QW weekly. The bottom and top of whiskers represents the minimum and maximum values excluding outliers, which are plotted separately. The lower and upper ends of the box represent the first and third quartile, the bar within the box represents the median value and the diamond within the box represents the mean value
