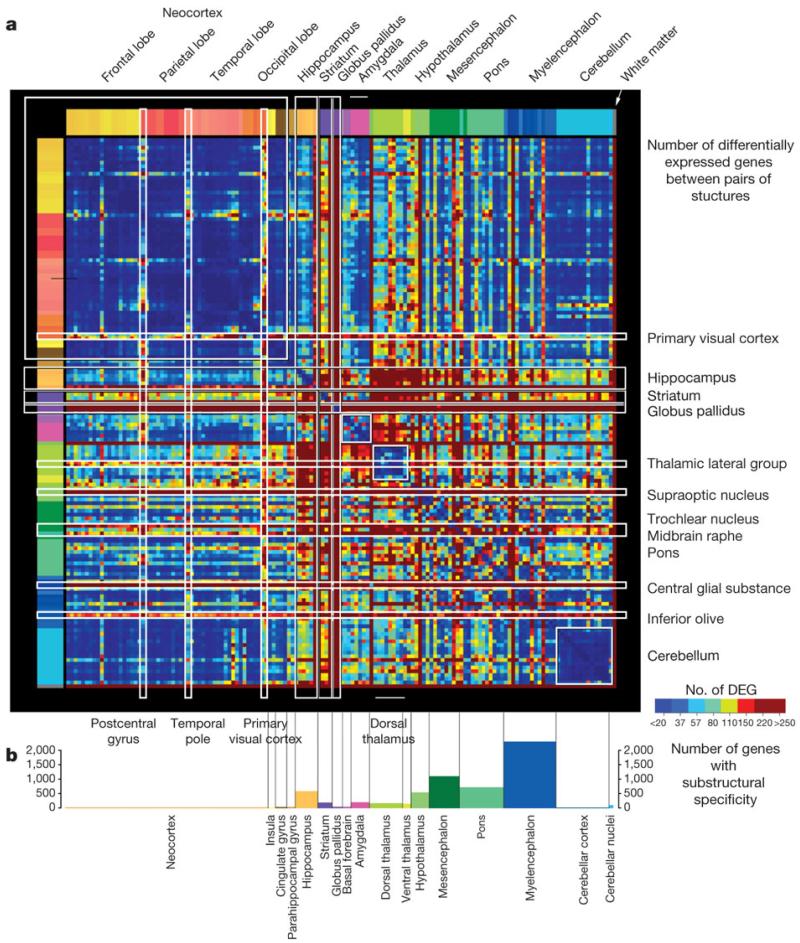
Figure 4. Structural variation in gene expression.
a, Matrix of differential expression between 146 regions in both brains. Each point represents the number of common genes enriched in one structure over another in both brains (BH-corrected P < 0.01, log2[fold change] > 1.5). DEG, differentially expressed genes. Several major regions exhibit relatively low internal variation (blue), including the neocortex, cerebellum, dorsal thalamus and amygdala. Subcortical regions show highly complex differential patterns between specific nuclei. b, Frequency of marker genes with selective expression in specific subdivisions of major brain regions (greater than twofold enrichment in a particular subdivision compared to the remaining subdivisions).

