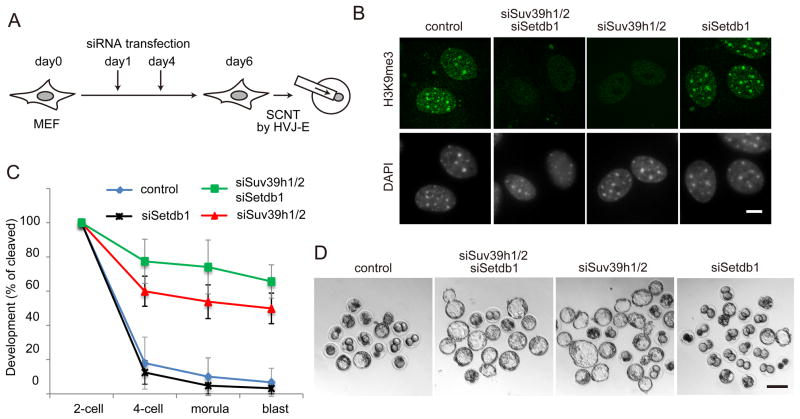
Figure 6. Suv39h1/2 is responsible for the establishment of the H3K9me3 barrier.
(A) Schematic illustration of SCNT using siRNA transfected MEF cells (see Extended Experimental Procedures for details).
(B) Representative images of MEF cells stained with anti-H3K9me3 antibody and DAPI at day 6 of transfection. Scale bar, 10 μm.
(C) Preimplantation development rate of SCNT embryos derived from different knockdown MEF cells. Error bars indicate s.d. of three biological replicates.
(D) Representative images of SCNT embryos after 120 hours of culturing in vitro. Scale bar, 100 μm.

