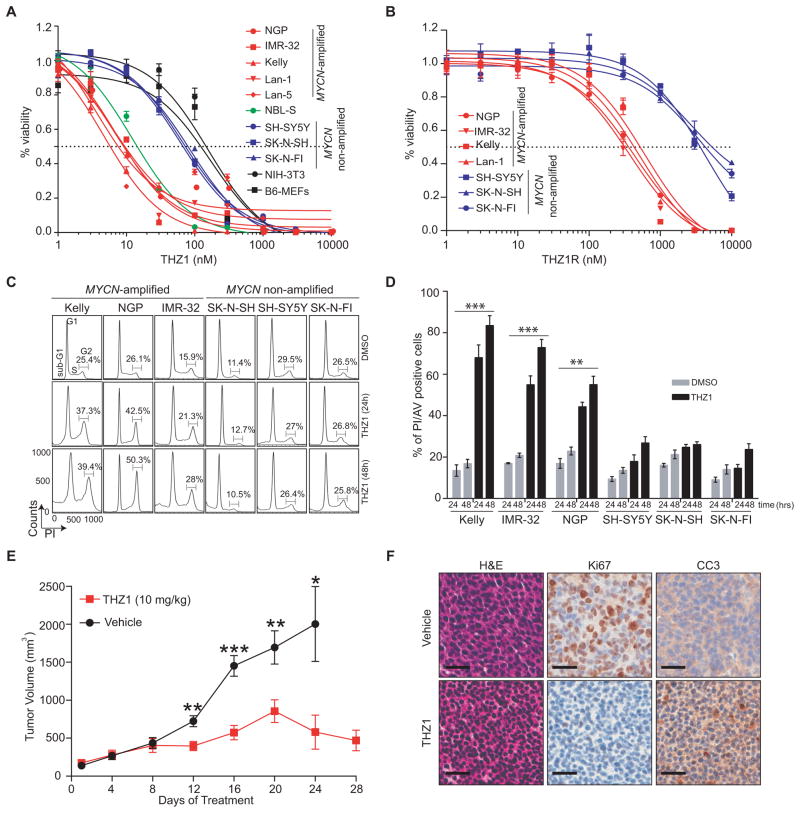
Figure 1. THZ1 Exhibits High Potency and Selectivity Against MYCN-amplified Tumor Cells.
(A) Dose-response curves of MYCN-amplified and nonamplified human NB and murine fibroblast cells after treatment with increasing concentrations of THZ1 for 72 hr. Percent cell viability relative to that of DMSO-treated cells is shown here and in (B). Data represent mean ± SD of 3 replicates here and in (B).
(B) Dose-response curves of NB cells treated as in (A) with the reversible CDK7 inhibitor THZ1R.
(C) Cell-cycle analysis of MYCN-amplified vs. nonamplified NB cells exposed to THZ1 (100 nM × 24 and 48 hr) by flow cytometry with propidium iodide (PI) staining. Results are representative of 3 replicates. The scale and axes are indicated in the lower left corner.
(D) Apoptosis analysis in MYCN-amplified and nonamplified NB cells treated with THZ1 as in (C) by flow cytometry with Annexin V staining. Data represent mean ± SD of 3 replicates. ***p<0.0001, **p<0.001 (Student’s t-test).
(E) Tumor volumes of MYCN-amplified human NB xenografts in NU/NU (Crl:NU-Foxn1nu) mice treated with THZ1 (10 mg/kg IV twice daily) (n=14) or vehicle (n=9) for 28 days. Mean ± SD values are presented. ***p<0.001; **p<0.01; *p<0.05 (multiple t-test, Holm-Sidak method).
(F) Immunohistochemical (IHC) analysis of morphology (hematoxylin & eosin, H&E), proliferation (Ki67) and apoptosis (cleaved caspase 3, CC3) in tumors harvested from animals treated with vehicle or THZ1 as in (E) for 12 days. Scale bar, 25 μM.

