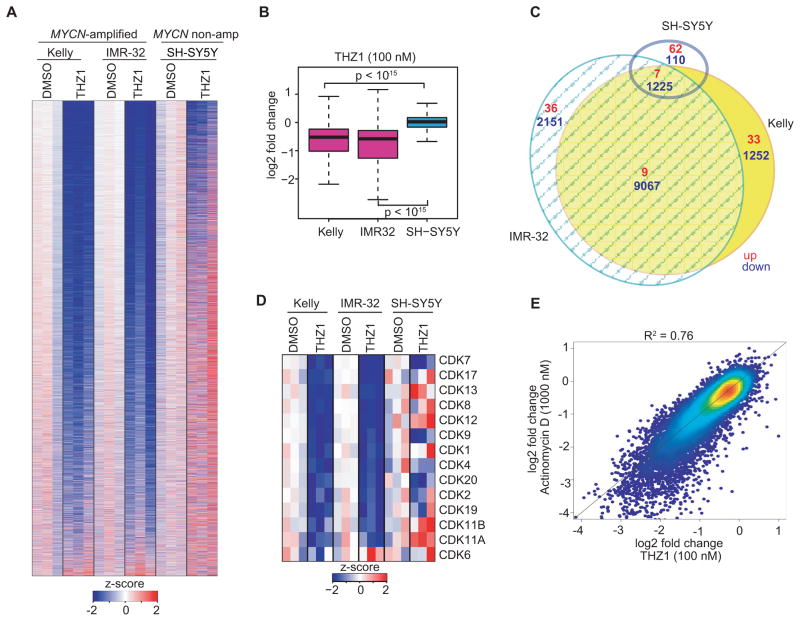
Figure 3. THZ1 Causes Massive Downregulation of Actively Transcribed Genes in MYCN-overexpressing NB Cells.
(A) Heat map of gene expression values in MYCN-amplified and nonamplified cells treated with THZ1 (100 nM for 6 hr) vs. DMSO. Rows show z-scores calculated for each cell type.
(B) Quartile box plots of log2 fold changes in gene expression in MYCN-amplified and nonamplified cells treated with DMSO or THZ1 at the same dose and duration as in (A). Box plot whiskers extend to 1.5 times the interquartile range (n=18,665 expressed genes, p<10−15 for Kelly vs. SH-SY5Y and IMR-32 vs. SH-SY5Y, two-sided Mann-Whitney U test).
(C) Venn diagram depicting the overlap between sets of differentially expressed transcripts (THZ1 vs. DMSO) in MYCN-amplified (Kelly, IMR-32) and nonamplified (SH-SY5Y) cells treated with THZ1 as in (A). Red represents upregulated and blue, downregulated transcripts.
(D) Heat map of gene expression values of transcriptional and cell cycle CDKs in MYCN-amplified and nonamplified cells treated with THZ1 as in (A) vs. DMSO. Rows show z-scores calculated for each cell type.
(E) Correlation between log2 fold changes in gene expression following THZ1 (100 nM) vs. DMSO treatment and actinomycin D (1 μM) vs. DMSO treatment for 6 hr. in MYCN-amplified NB cells. R2 (coefficient of determination) calculated using a simple linear regression model.
See also Figure S3.

