
Figure 7. Unsupervised clusters for miRNA-seq data.
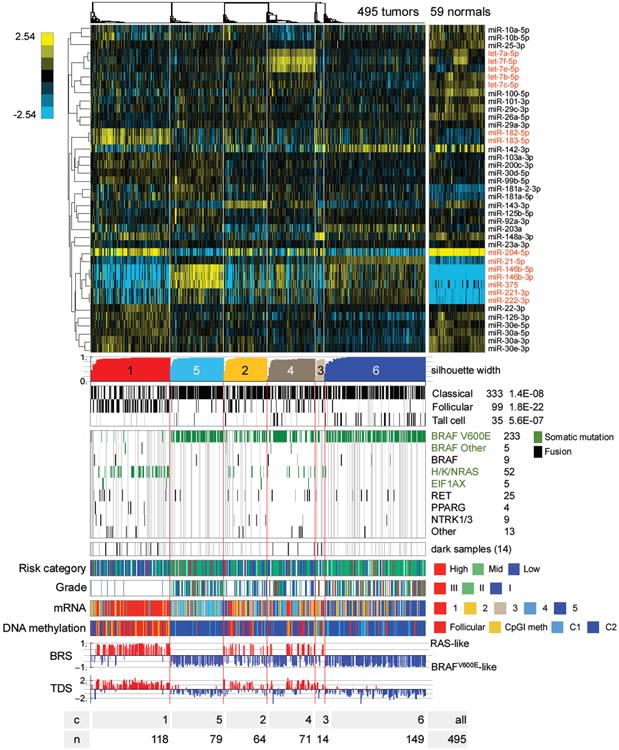
Heatmap showing discriminatory miRs (5p or 3p mature strands) with the largest 6% of metagene matrix scores (see Supplement), as well as miR-204-5p, 221-3p and 222-3p, which were highlighted in correlations to BRS and TDS scores (see Figure S10D). The scalebar shows log2 normalized (reads-per-million, RPM), median-centered miR abundance. miR names in red are discussed in the text. Gray vertical lines in the clinical information tracks mark samples without clinical data, and in the mutation tracks gray lines identify samples without sequence data. See also Figures S9, S10 and Tables S4C,D,E, 5G, 6.