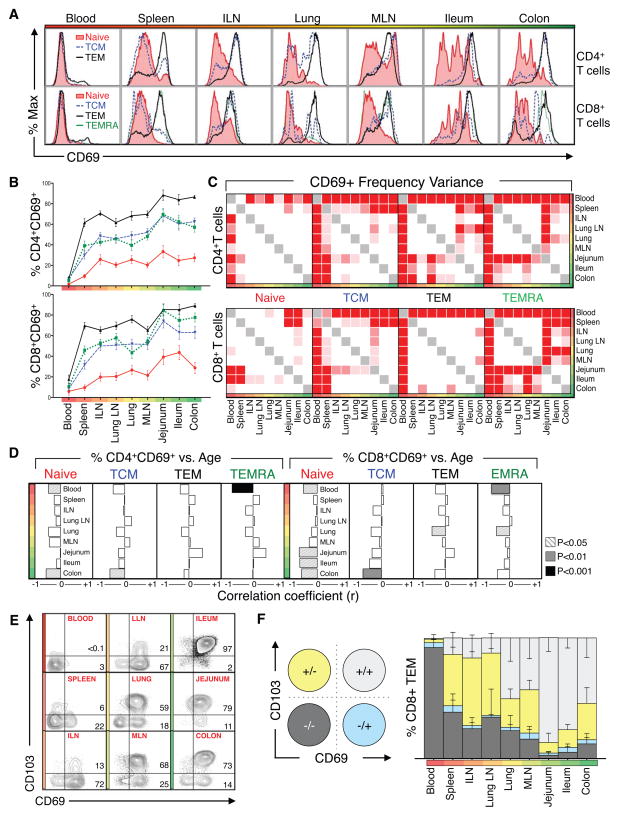
Figure 4. CD69 expression marks T cell compartmentalization in tissue sites.
(A) Representative flow cytometry histograms showing CD69 expression by CD4+ (top) and CD8+ (bottom) naïve (red), TCM (blue), TEM (black), and TEMRA (green) cell subsets from donor #101. (B) Mean frequency (+− SEM) of CD69+ CD4+ and CD8+ T naïve, TCM, TEM, and TEMRA cell subsets among blood, lymphoid and mucosal tissues. Data shown are compiled from 29 donors (Table S2). (C) Distribution variance of CD69+CD4+ (top) and CD8+ (bottom) naïve, TCM, TEM, and TEMRA subsets in blood, lymphoid and mucosal tissues from (B). (D) Spearman correlation analysis of changes in CD69+ subset tissue distribution with increasing age. Correlation strength and directionality (r=−1, left to r=+1, right) is shown for each tissue. Correlation significance for each tissue is denoted by shading (p<0.05, striped; p<0.01, gray; p<0.001, black; not significant, white). Individual r- and p-values are listed in Table S5) (E) Representative flow cytometry plots showing CD103/CD69 expression patterns by CD8+ TEM subsets in circulation, lymphoid, and mucosal tissues. Number in upper and lower right quadrants indicate %CD69+CD103+ and %CD69+CD103− cells, respectively. (F) Overall distribution of TEM subpopulations delineated by CD69 and CD103 expression: CD69+CD103+, light gray; CD69+CD103−, blue; CD69− CD103+, yellow; and CD69− CD103−, dark gray. Graphs shows mean frequencies (±SEM) of these subsets among CD8+ TEM from nine tissues compiled from 10 donors with each tissue representing 5 or more donors. Individual donors used are indicated in Table S2.

