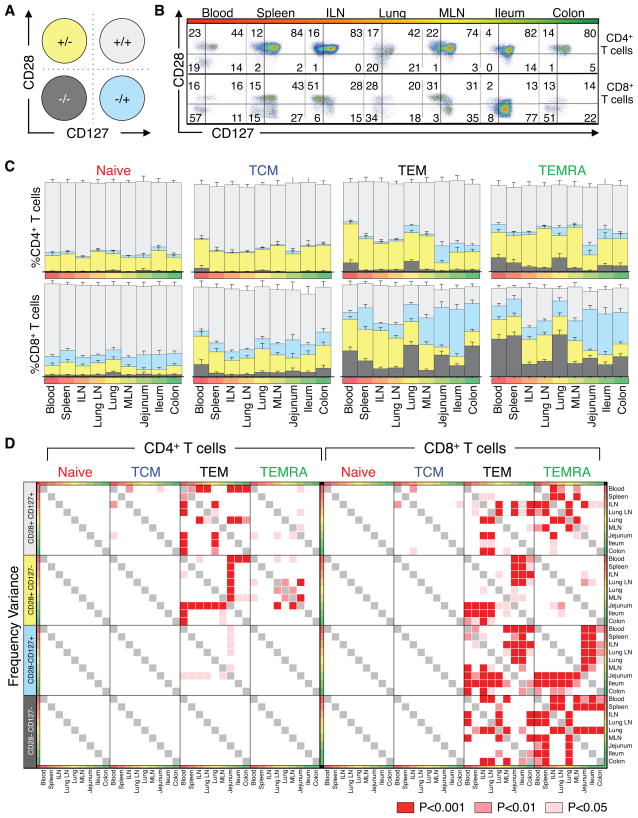
Figure 5. CD28 and CD127 expression reveal distinct homeostatic patterns in lymphoid and mucosal tissues.
Coordinate expression of CD28 and CD127 by CD4+ and CD8+ naïve, TCM, TEM, and TEMRA subsets was analyzed. (A) Diagram showing the 4 subpopulations delineated by CD28/CD127 expression: CD28+ CD127+, light gray; CD28− CD127+, blue; CD28+ CD127−, yellow; and CD28− CD127−, dark gray T cells. (B) Representative flow cytometry plots showing pattern of CD28 and CD127 expression by CD4+ (top) and CD8+ (bottom) TEM cells. (C) Frequency (±SEM) of these functional subsets in (B) within CD4+ (top) and CD8+ (bottom) naïve, TCM, TEM, and TEMRA subsets. Individual frequencies from each of 23 donors are in Table S3. (D) Variance between CD4+ (left) and CD8+ (right) CD127/CD28 subset frequencies within naïve, TCM, TEM, and TEMRA subsets was assessed for each tissue by two-way ANOVA and corrected by Holm-Sidak for multiple comparisons. Significant variation among tissues is denoted by colored squares (p<0.001, red; p<0.01, light red; p<0.05, pink). Individual p-values for each tissue are listed in Table S4.

