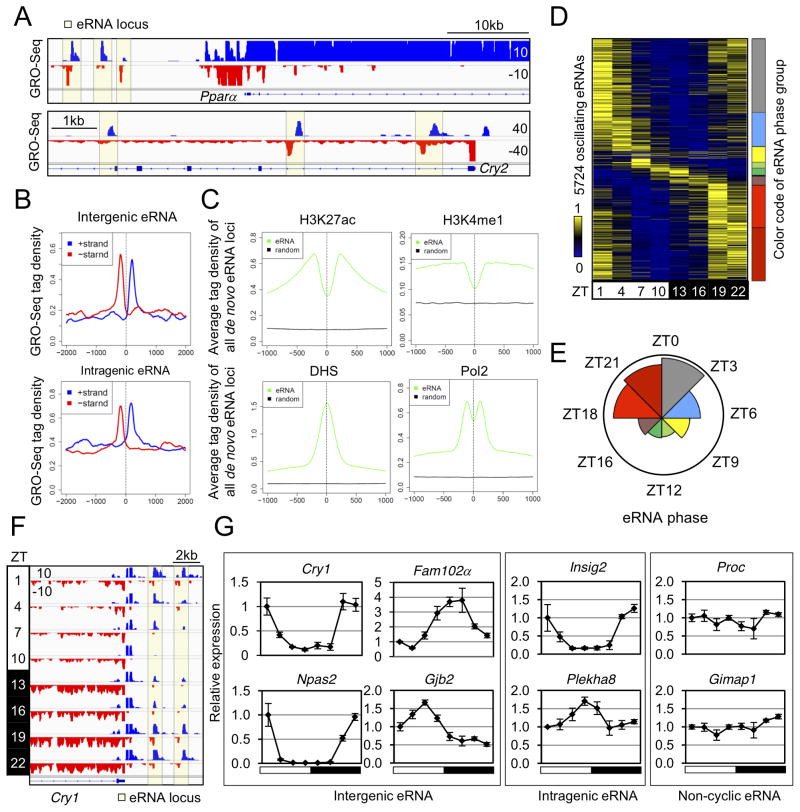
Figure 2. De novo identification of circadian liver enhancer RNAs.
(A) Genome browser view of intergenic (upper panel) and intragenic (lower panel) eRNAs (yellow boxes). (B) GRO-seq tag densities in 4kb windows surrounding de novo intergenic (upper panel) and intragenic (lower panel) eRNA loci are shown for the plus (blue) and minus (red) strand. Y-axis shows average reads per 10 million reads (RPTM) per 10bp bin. (C) Average ChIP-seq tag densities of epigenetic marks in 2kb window surrounding all de novo eRNA loci (prior to the selection of high confidence eRNAs) and matched control regions. (D) Heat map of the relative transcription of oscillating eRNAs throughout the day. Color coding of eRNA population in 8 phase groups (from ZT0 to ZT24, at 3 hour intervals) is shown on the right. (E) Rose diagram showing the prevalence of eRNA loci in each phase group. For each wedge, the color corresponds to that in (D) and the area is proportional to the number of eRNAs in that group. (F) Genome browser view of oscillating eRNAs at Cry1 locus. (G) RT-qPCR validation of circadian transcription for intergenic, intragenic, and non-cyclic eRNAs at indicated gene loci. Data are expressed as mean±SEM (n=3–4 per time point) and normalized to the first time point. See also Figure S2 and Table S2.

