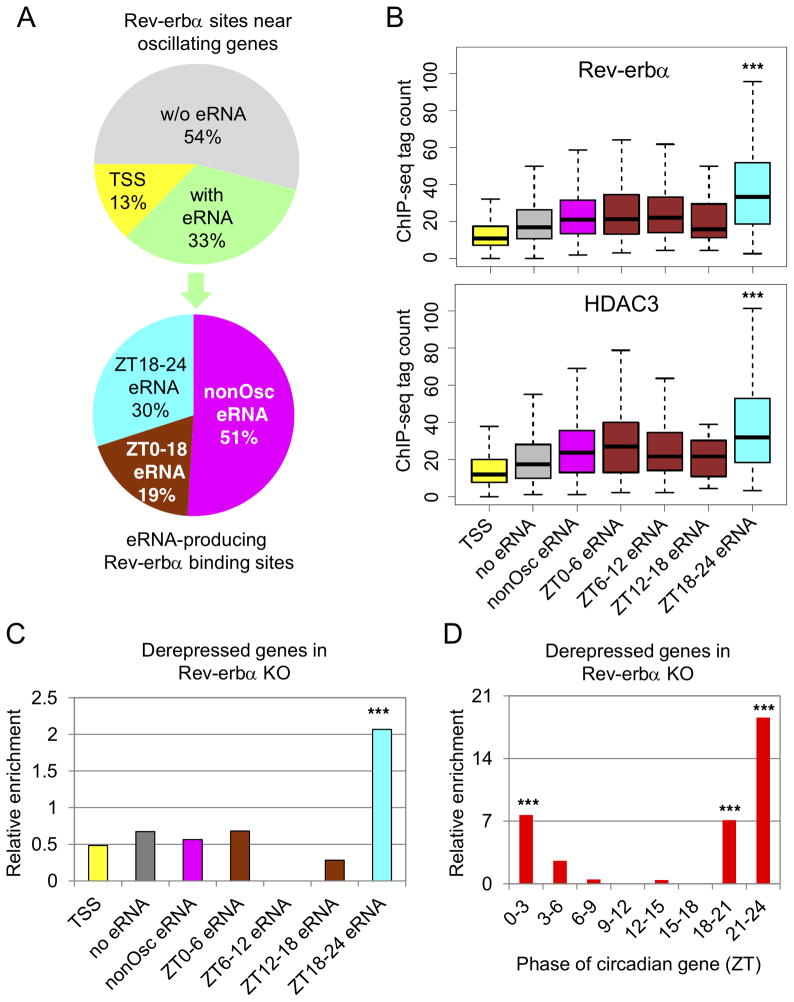
Figure 5. Circadian eRNAs reveal the function of the Rev-erb.
α cistrome at oscillating genes.
(A) Distribution of Rev-erbα ChIP-seq peaks near circadian genes (upper panel) and subdistribution of eRNA-producing Rev-erbα peaks near circadian genes (lower panel). (B) Boxplot showing Rev-erbα and HDAC3 peak height at binding sites from panel A. Y-axis indicates normalized tag count in each peak (RPTM) (***p<0.001, one-way ANOVA and Tukey’s test). (C) Enrichment of derepressed genes in Rev-erbα −/− mice at circadian genes bound by different Rev-erbα peaks from panel A relative to a random set of Rev-erbα peaks (hypergeometric test, ***p<0.001). (D) Enrichment of derepressed genes in Rev-erbα −/− mice in 8 groups of circadian genes with indicated phases relative to randomly selected genes (hypergeometric test, ***p<0.001). See also Figure S5 and Table S4.

