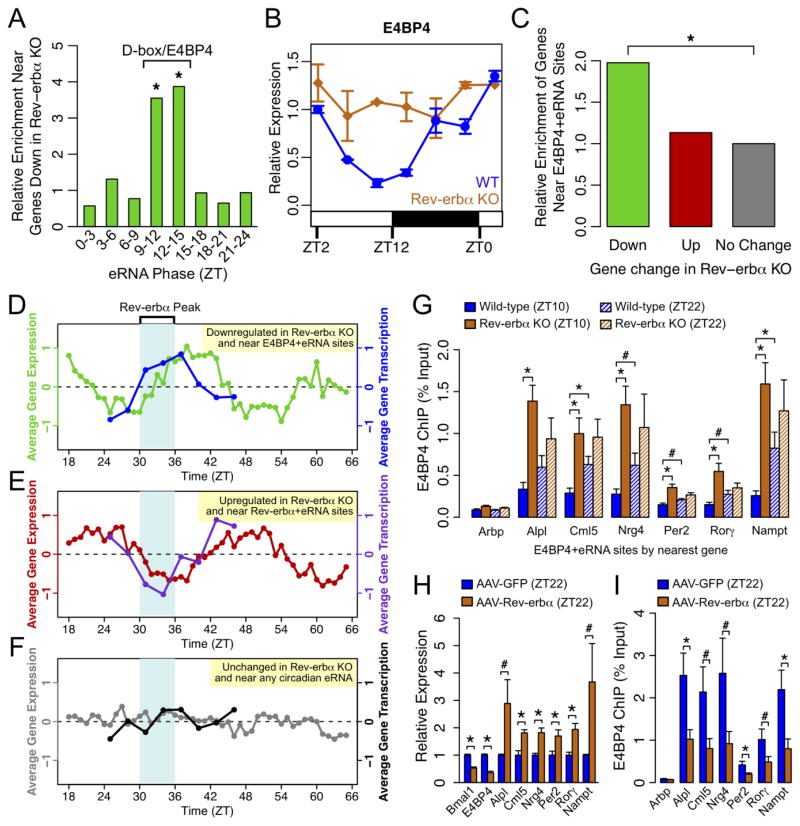
Figure 6. E4BP4 functions downstream of Rev-erbα.
(A) Enrichment of oscillating eRNAs in each phase group near genes downregulated in Rev-erbα −/− livers relative to control genes. Significantly enriched phases are noted as corresponding to D-box/E4BP4-enriched phase group. (hypergeometric test, *p<0.05). (B) mRNA expression of E4BP4/Nfil3 in WT and Reverbα −/− livers measured by RT-qPCR throughout the day. Data are expressed as mean±SEM (n=2 per time point and genotype) normalized to the first WT time point. (C) Enrichment of E4BP4+eRNA bound genes among those downregulated (green) or upregulated (red) in Reverbα −/− livers relative to unchanged genes (grey) (hypergeometric test, *p<0.05). (D-F) Average circadian expression profiles in WT mouse livers (Hughes et al., 2009) and corresponding transcription profiles by GRO-seq for (D) genes downregulated in Rev-erbα −/− livers within 200kb of E4BP4 binding at ZT9–15 circadian eRNAs, (E) genes upregulated in Rev-erbα −/− livers within 200kb of Rev-erbα binding at ZT18–24 circadian eRNAs, and (F) non-regulated control genes (expressed in liver within 200kb of near circadian eRNA in any phase). (G) ChIP-qPCR of E4BP4 binding at genes downregulated in Rev-erbα −/− livers at ZT10. Binding is shown at ZT10 (solid bars) and ZT22 (hashed bars) in WT (blue) and Rev-erbα −/− (orange) livers. Data are expressed as mean±SEM (One-way ANOVA, *p<0.05, #p<0.1, n=3–4 per group). (H) mRNA expression measured by RT-qPCR in liver overexpressing Rev-erbα (mice injected with AAV-Tbg-Rev-erbα) or control liver (mice injected with AAV-Tbg-GFP) at ZT22. Data are expressed as mean±SEM (One-way ANOVA, *p<0.05, #p<0.1; n=6 per group). (I) ChIP-qPCR of E4BP4 binding at same sites as (G) in liver overexpressing Rev-erbα (blue) or control liver (orange). Data are expressed as mean±SEM (One-way ANOVA, *p<0.05, #p<0.1, n=5–6 per group). See also Figure S6.

