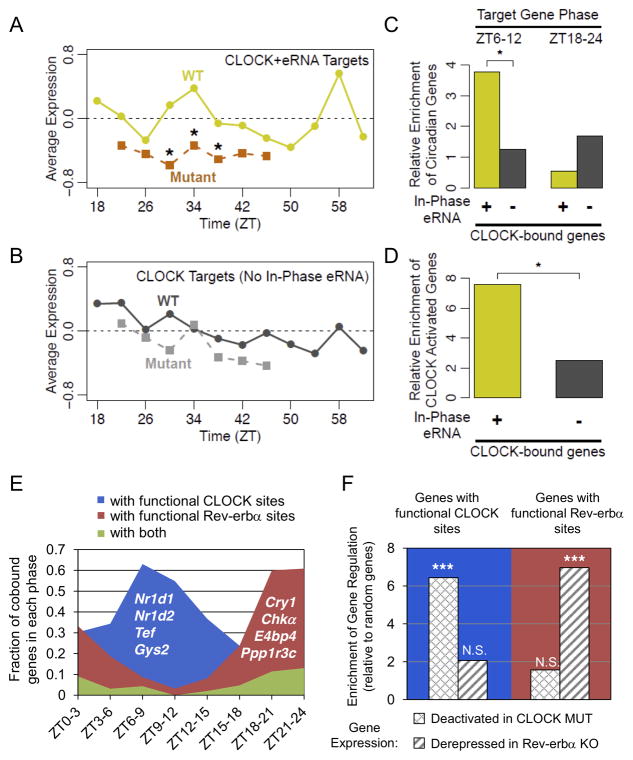
Figure 7. Circadian eRNAs define functional cistromes that distinguish CLOCK and Reverbα target genes.
(A) Average expression of genes within 200kb of CLOCK binding sites producing eRNA in phase with CLOCK binding and target gene expression in WT (yellow line) and Clock mutant (orange line) mouse livers from (Miller et al., 2007) (*Wilcoxon test of gene fold-change distribution versus matching time points in (B), *p<0.05). (B) Average expression of genes within 200kb of CLOCK binding sites lacking in phase eRNA in WT (dark grey line) and Clock mutant (light grey line) mouse livers from (Miller et al., 2007). (C) Enrichment of circadian genes expressed in phase with CLOCK binding (ZT6–12) or anti-phase to CLOCK binding (ZT18–24) for the gene groups used in panel A (yellow) and panel B (grey) relative to random genes (hypergeometric test, *p<0.05). (D) Enrichment of genes downregulated in Clock mutant livers among the gene groups used in panels A-C relative to random genes (hypergeometric test, *p<0.05). (E) Fraction of oscillating genes co-bound by CLOCK and Rev-erbα that are within 200kb of TF binding sites producing rhythmic eRNA in phase with CLOCK activation (blue), Rev-erbα repression (red), or both (green). Oscillating genes are divided according to their phases. Representative genes are noted in each group. (F) Enrichment of CLOCK and Rev-erbα regulatedgenes (expression fold change in mutant >95% of random genes) in those with eRNA predicted functional binding sites in panel E, relative to random genes (hypergeometric test, ***p<0.001, N.S. p>0.05). See also Figure S7 and Table S5.

