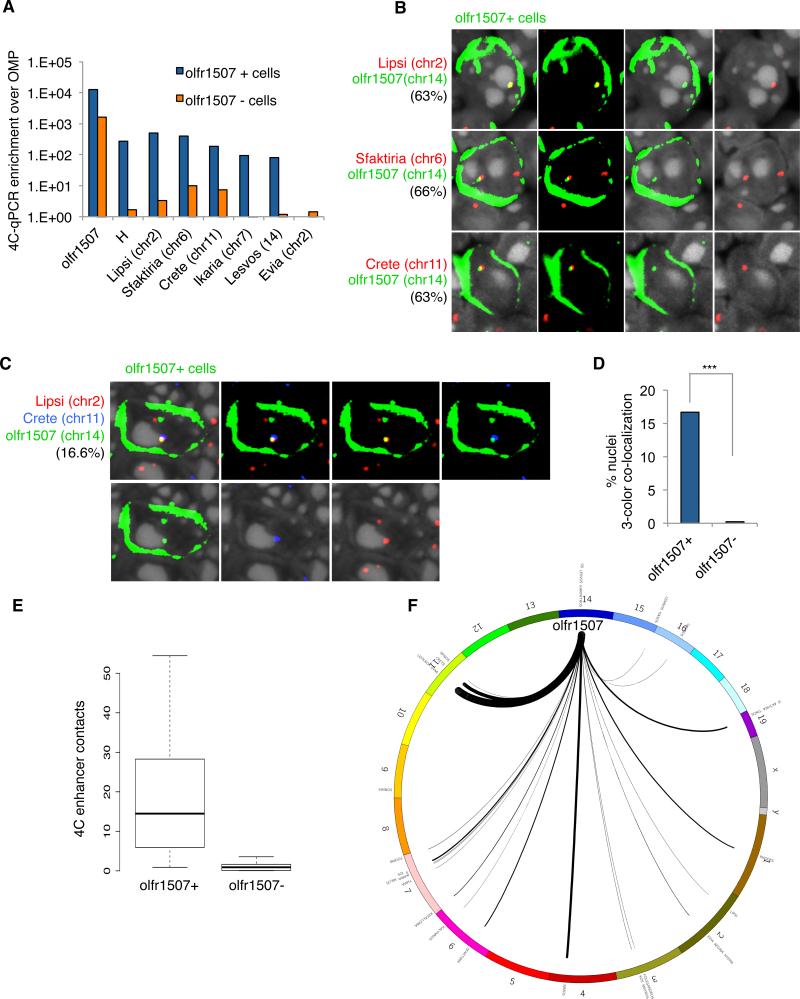
Figure 3. Multiple enhancers interact in trans with a chosen OR.
A. 4C from Olfr1507-ires-GFP FAC-sorted cells, library constructed by inverse PCR off Olfr1507 promoter. qPCR enrichment of candidate OR enhancers relative to OMP in GFP+ and GFP− cells. Error bars display SEM between triplicates.
B. IF staining for Olfr1507 (green) and two-color DNA FISH for Olfr1507 DNA (green) and Lipsi, Sfaktiria, and Crete DNA (red). DAPI is nuclear stain (gray). Percent of Olfr1507 positive cells containing co-localized red and green probes is indicated for each combination.
C. IF staining for Olfr1507 (green) and DNA FISH for Olfr1507 (green), Lipsi (red) and Crete (blue) DNA. DAPI is nuclear stain (gray). Percent of Olfr1507+cells containing three color co-localization is indicated.
D. Quantification of C. Percent Olfr1507+and Olfr1507− OSNs containing three-color co-localizations.
E. 4C-seq from Olfr1507iresGFP positive and negative cells, library constructed by inverse PCR from Olfr1507 promoter. Average number of contacts for OR enhancers are plotted. Y-axis is RPKM that span two different putative enhancers at an expected ligation site.
F. Circos plot (Krzywinski et al., 2009) of OR enhancer chromosomal locations and 4C-seq contacts with Olfr1507 promoter in Olfr1507+ cells. Lines are weighted by frequency of interaction (RPKM that span two different putative enhancers at an expected ligation site). See Table S5 for enhancer names, locations and interaction frequencies.
See also Figure S3

