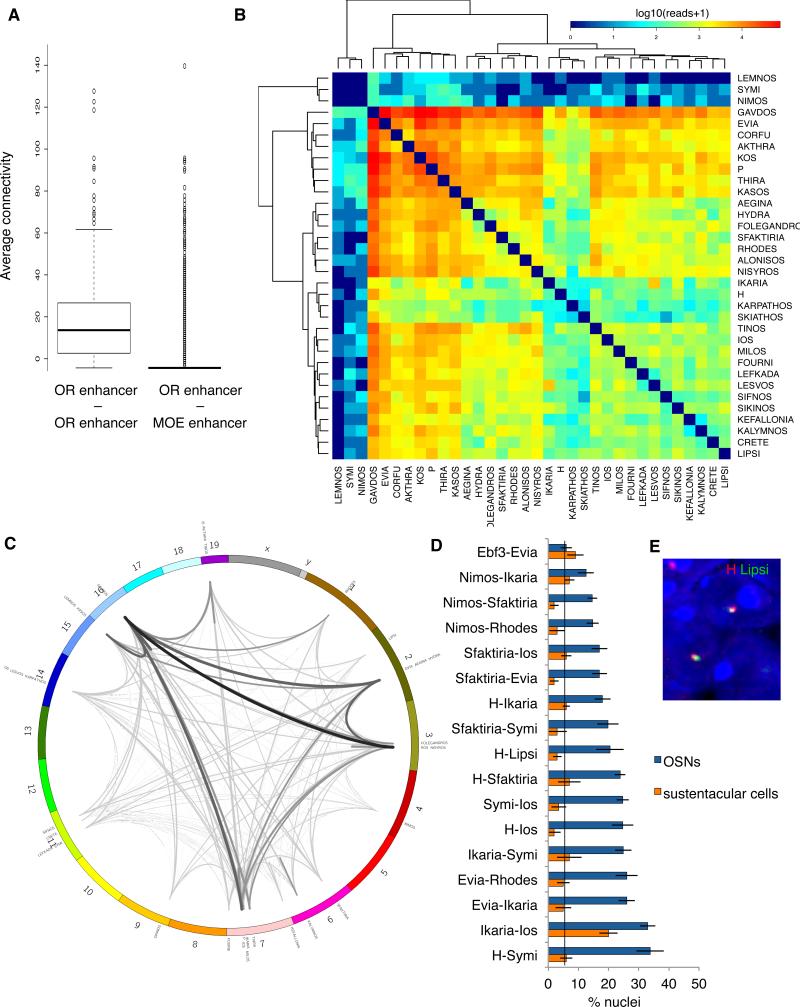
Figure 4. An intricate network of enhancer interactions in mouse OSNs.
A. Average Hi-C connectivity of OR enhancers with other OR enhancers compared to average connectivity of OR enhancers to MOE enhancers. Y-axis is reads spanning two different genomic regions normalized to the total number of reads.
B. Contact matrix depicting interaction frequency between candidate OR enhancers (red highest, blue lowest interaction frequency). Normalized read counts spanning two enhancer regions were divided into 20 bins, with 5 bins representing each color shade (color key provided for quantitation). Interactions between enhancers are hierarchically clustered.
C. Circos plot of OR enhancer chromosomal locations and Hi-C contacts. Lines are weighted according to frequency of enhancer-enhancer interactions.
D. Results of DNA FISH screen. X-axis is percent nuclei containing two-color co-localization between OR enhancer candidates, Y-axis is enhancer candidate pairs tested. OSN and sustentacular cell nuclei indicated. Vertical line is baseline OSN co-localization frequency. Ios and Ikaria were not significantly reduced in sustentacular cells, probably due to the genomic linkage of these DNA elements which both reside on chromosome 7 at 9MB distance. Error bars are SEM from multiple sections of the MOE.
E. Representative DNA FISH for H (red) and Lipsi (green) in OSN nucleus. The blue nuclear stain is DAPI.
See also Figure S4.

